
Posted by Nodus Labs | April 7, 2022
Healthcare Data: Medical Transcriptions Analysis

In this case study, we will demonstrate how text network analysis can be used to better understand medical transcriptions data. This approach can be used to better understand the patients’ complaints, classify them into categories, and also reveal some insights about the treatment provided. As a data source, we will use freely available, anonymized medical records from Kaggle. For data analysis, we will be using InfraNodus visual text network analysis tool.
Preparing the Data
As the first step, we will inspect the medical records in order to see what kind of data is contained within. The CSV table provided has several columns that may be interesting for our analysis:
1) description of the problem (written by a doctor, from the patient’s words)
2) medical specialty (e.g. gastroenterology, neurology)
3) description of the treatment the patient obtained
Based on this information, we will create two separate graphs. The first graph will be based on the description of the problem field. The other graph will be based on the description of the treatment. Both graphs will use the “medical specialty” field to categorize the entries, so we can sample the data based on the typology provided.
Visualizing the Data as a Graph
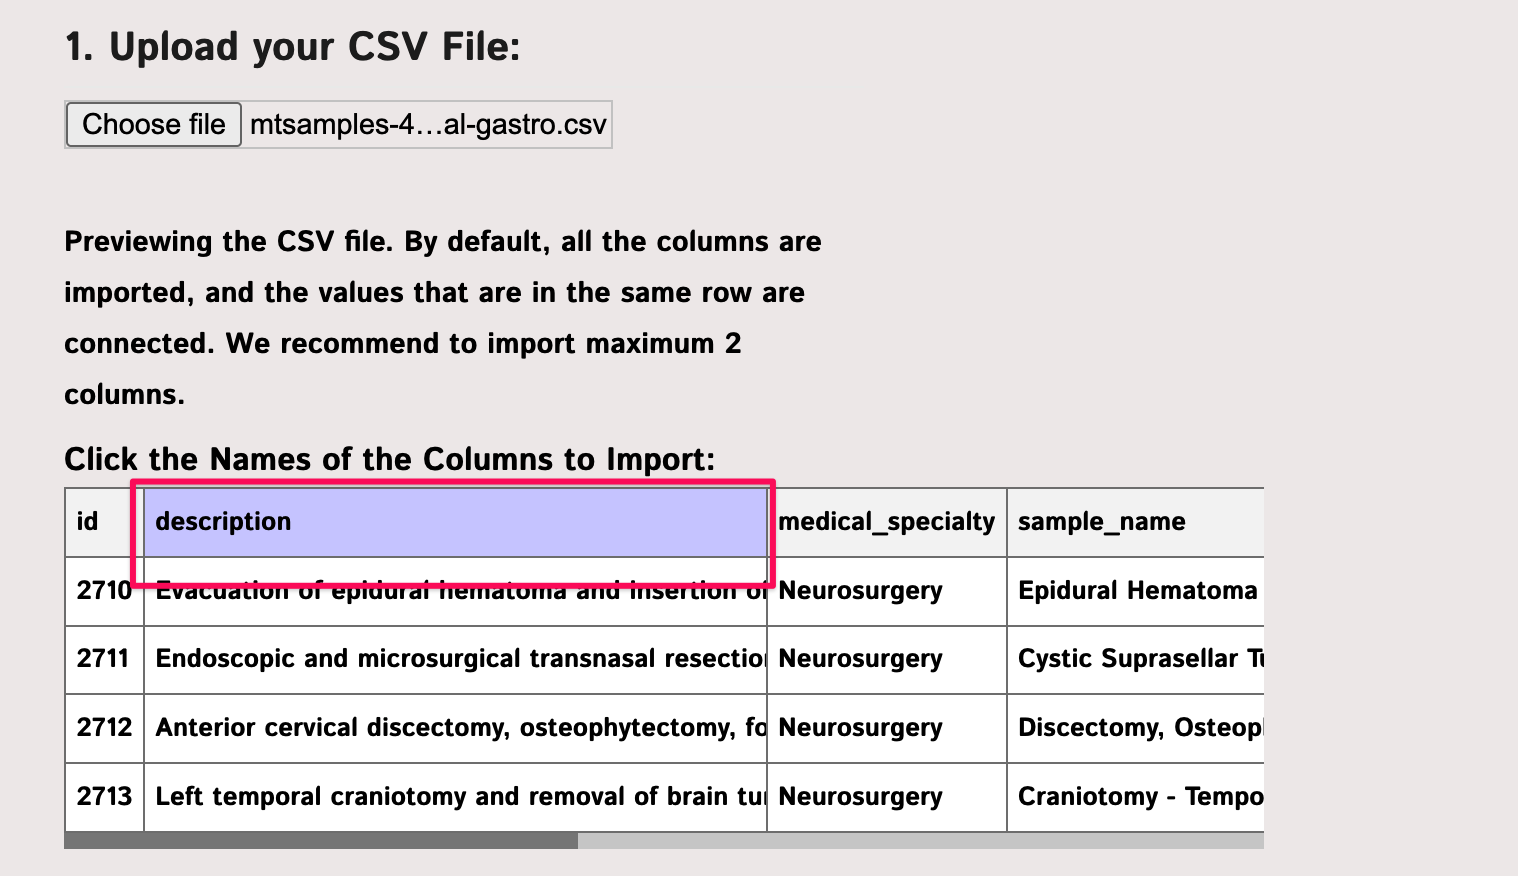
To visualize the data, we will use the InfraNodus CSV import functionality. As InfraNodus takes maximum 3 Mb at once on the small accounts, we will split the original file into 6 parts, 3 Mb each. We will then take one of those files containing the information on neurology, oncology, general treatment, and gastroenterology types — quite diverse. We will then choose the “description” field as the column to import:
As the next step we choose the “medical specialty” field as the categorization field and import the data as a graph:
The logic behind this graph is simple: the words are converted into lemmas, which are represented as nodes in the graph. The co-occurrence of those words are represented as the connections. The resulting graph is then analyzed using various algorithms from network science, which identify the most influential nodes (bigger on the graph) and the topical clusters: the groups of words that tend to co-occur in the same context (shown with the same color and in the Analytics panel on the right).
Most of the common stopwords (such as “a”, “the”, “is”, etc.) are removed and we also removed some more words that were frequently used but do not carry a specific meaning, such as “male”, “female”, “left”, “right”, “history”, “patient” — these are quite generic to the context (at the top right).
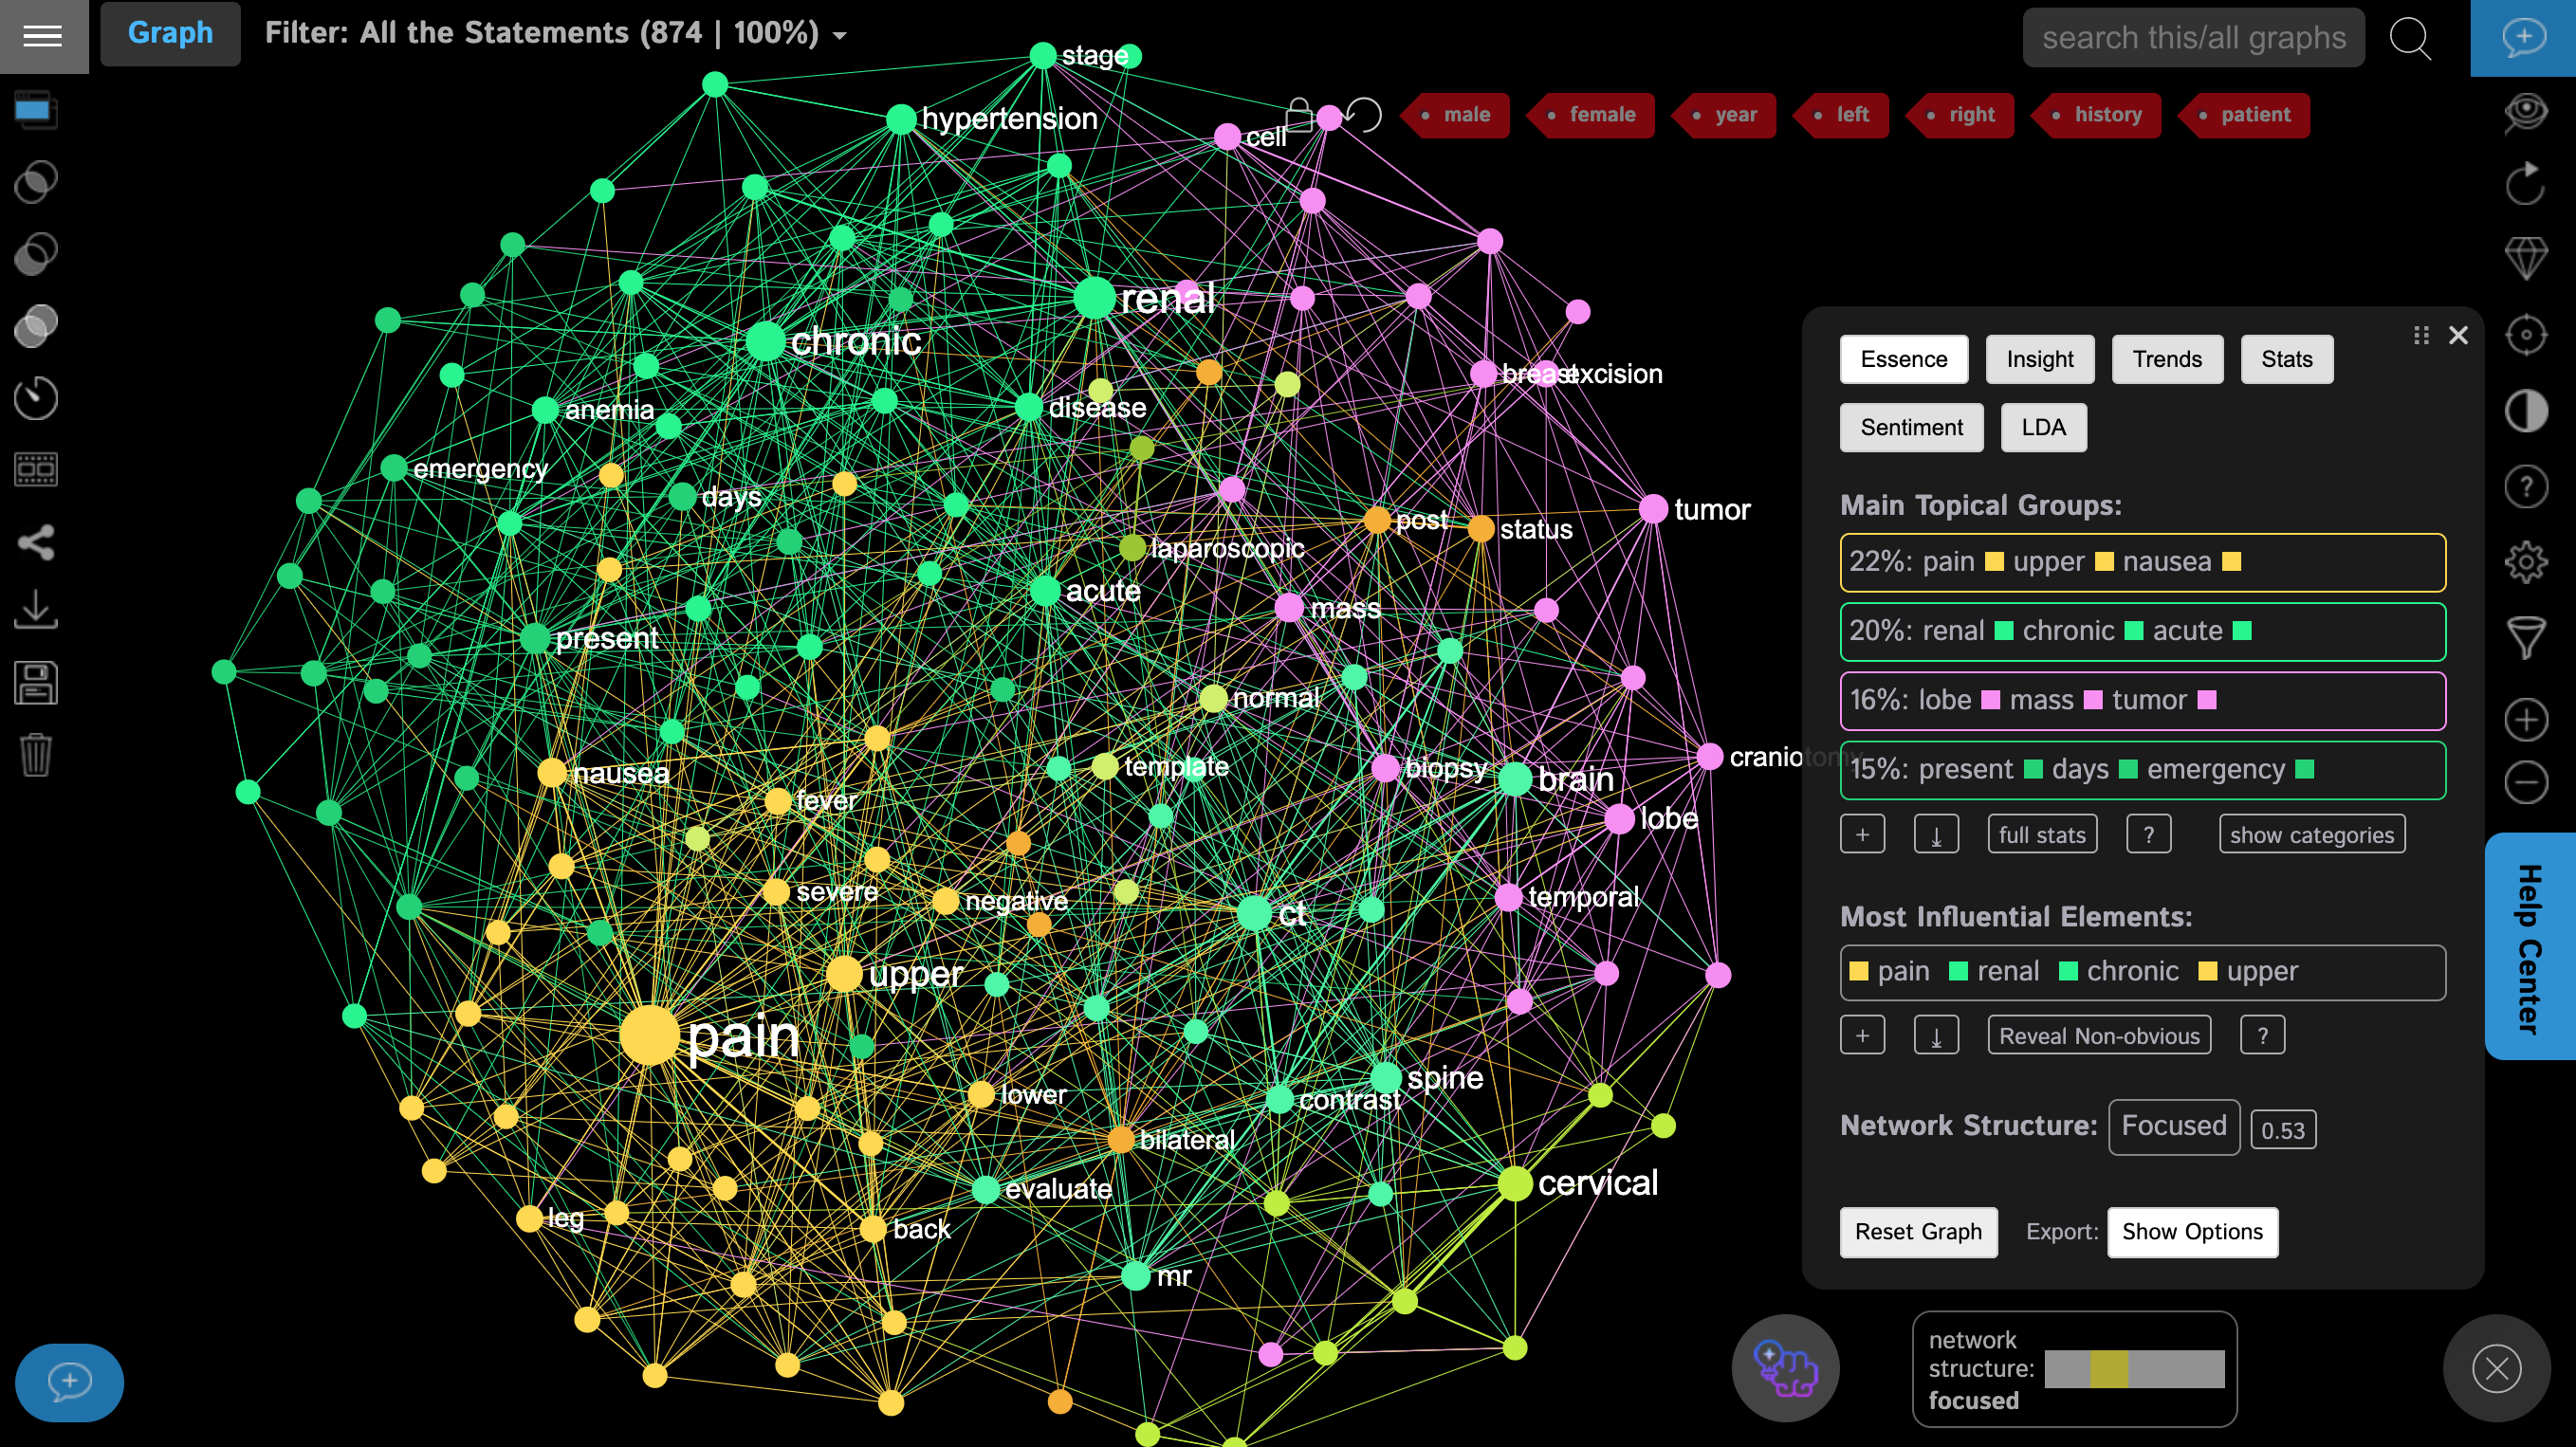
As a result, we see a graph of the most common symptoms that the patients have, according to the medical records:
a) pain in the upper region also connected to nausea (meaning those appear in the same complaints often),
b) chronic hypertension (also connected to the word renal),
c) brain and spine problems
Cutting the Data by Categories
Next, let’s cut the data by one of the categories (medical specialty), to see what kind of problems occur in the case of, for example, nephrology (the study of kindeys). In order to do that, we use the top filter panel in the graph, to show only the statements and the parts of the graph that belong to the “nephrology” category:
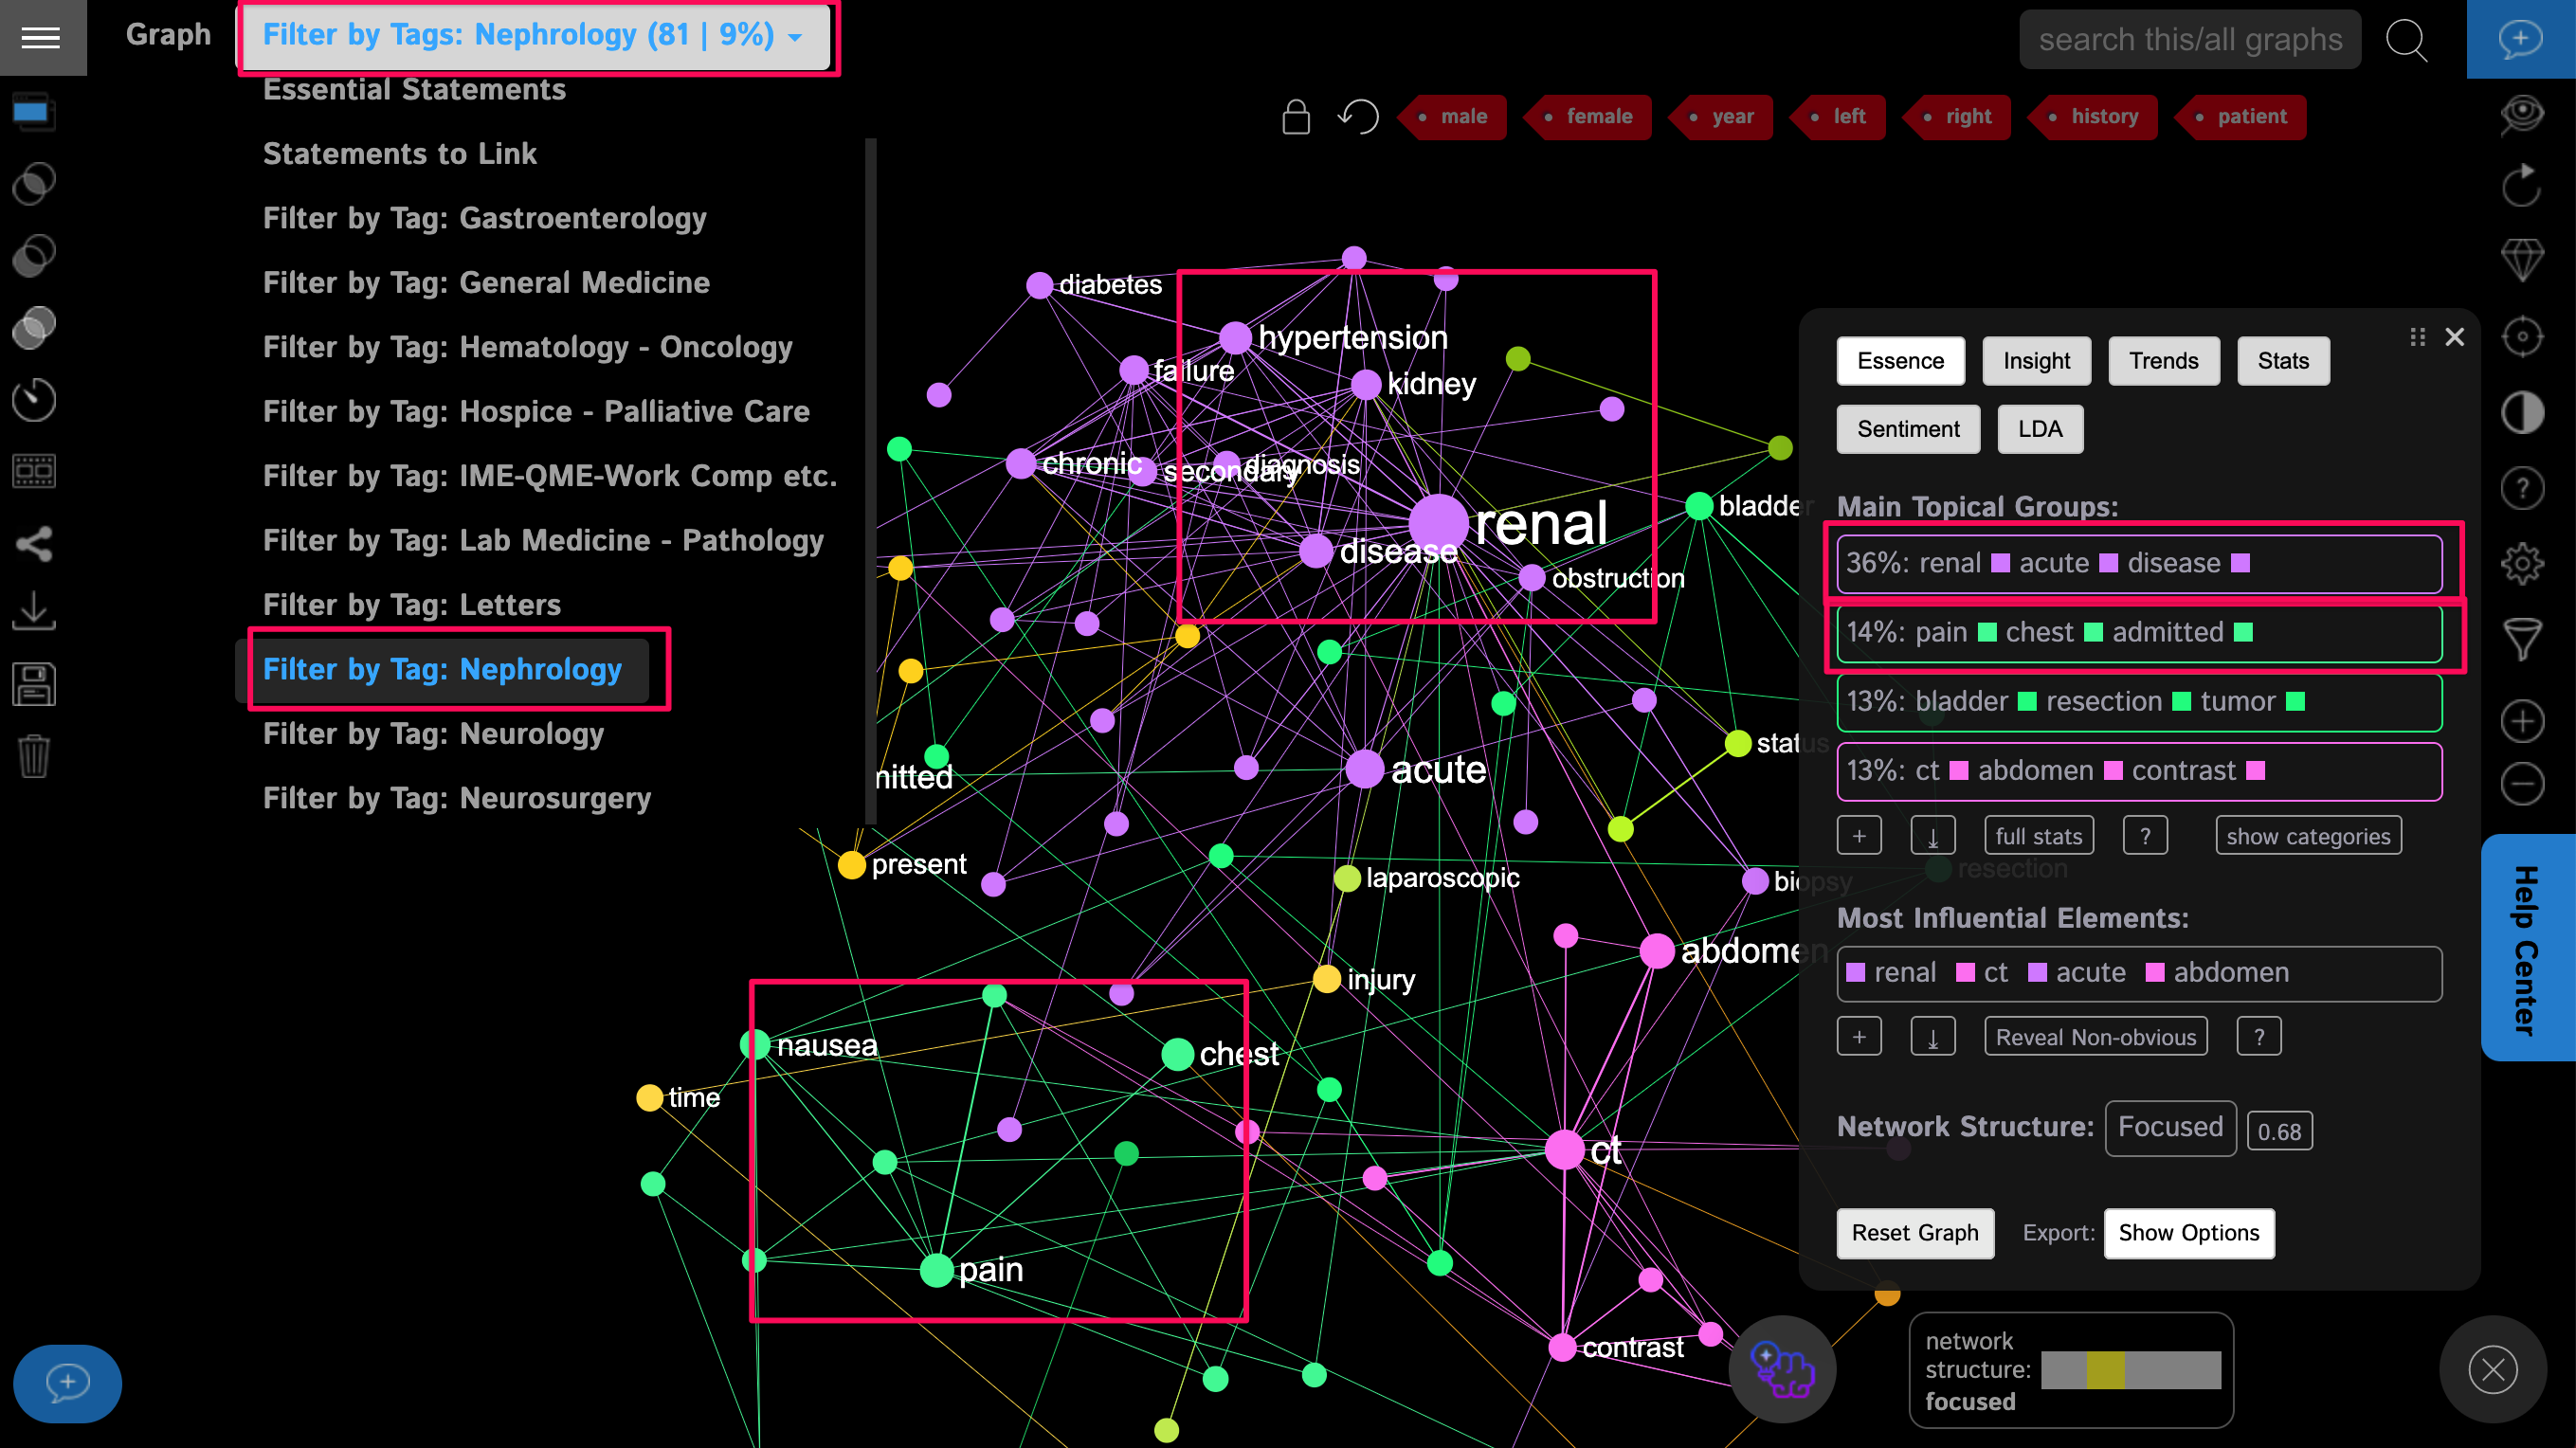
We will see that the most common symptoms in this category are renal problems, hypertension, chest pain, and nausea.
Interestingly, these results once again demonstrate how interconnected the body is and that kidney problems are related to hypertension.
To be continued....
