
Posted by Nodus Labs | July 23, 2019
Network Analysis of HotJar Customer Feedback
Customer feedback is the most important element of improving the business processes. And while there are many different tools to gather this feedback, there’s a lack of simple instruments to transform this feedback into actionable insights.
Most marketers resort to either one of these three options:
- Cumbersome manual qualitative review;
- Building brand association maps using tools like Worldle;
- Conducting a thorough review through data scientists using complex tools;
The problem of the first method is that it requires too much time, it’s not sustainable, it may be subjective, and there’s a lack of standards that would allow to trace the parameters over time. However, this is what most people end up doing because most of the tools that gather customer’s feedback do not provide adequate, easy-to-use tools to analyze that data.
The problem with second approach is that it’s probably better suited for school presentations, yet some are still using it to create reports for brands… It’s like going racing with a cart car. Fun, but inefficient.
The problem with the third approach is that it often requires too much man- and computing power for the task at hand.
In this case study we will present a solution that can work when none of the approaches above seem adequate…
Step 1: Gather the Clients’ Feedback (e.g. using HotJar)
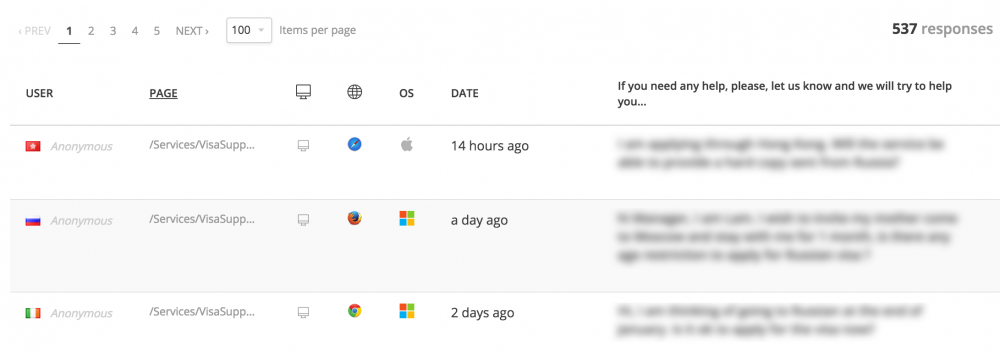
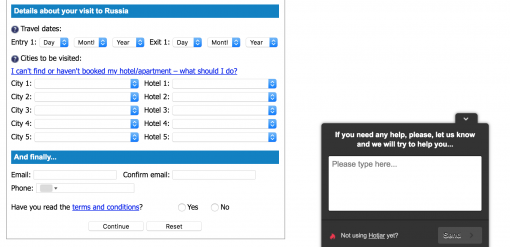
Our client, a popular travel guide to Russia, has an online form, which the clients can fill out to get a Russian visa support letter. It’s in their interest to increase the conversions and to better understand why the customers abandon the form. They installed a HotJar solution, which detects a customer who’s just about to leave the site and pops up a feedback form asking the client if there’s anything they would like help with. The customer leaves the data and it gets submitted into the system.
The resulting data looks something like this:
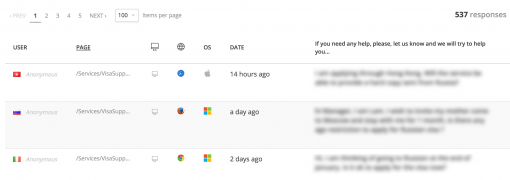
There are no filters, no way to see the summary of this feedback, no way to make samples etc. However, there’s a great feature: Export as CSV. When we export this feedback as CSV, we get a table of responses, which can then import in InfraNodus.
Step 2: Make Sense of the Data
InfraNodus is a text-to-network visualization tool that helps generate insight from any textual data. It converts any text into a network where the words are the nodes and their co-occurrences are the connections between them.
The main difference from a tag cloud (including tools like Wordle) is that it takes the context into account: so when you see a word emphasized it’s not only because it’s the most frequently mentioned, but also because it connects the different topics present within the customer feedback together. This helps the researchers to better understand the relations of the main terms to each other and to have a much more precise understanding of the customers’ problems.
All the researcher has to do is to copy and paste the feedback column from CSV into InfraNodus and they will get this visualization and analysis in a few seconds:
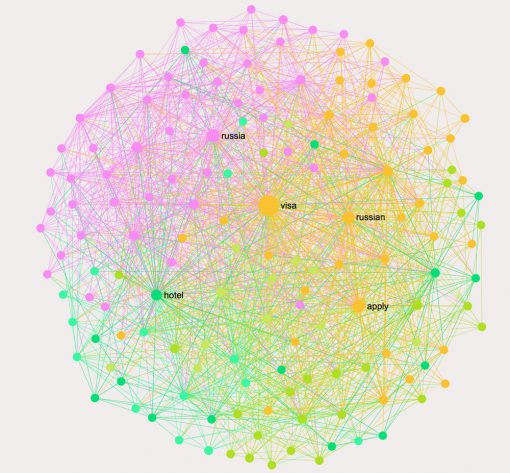
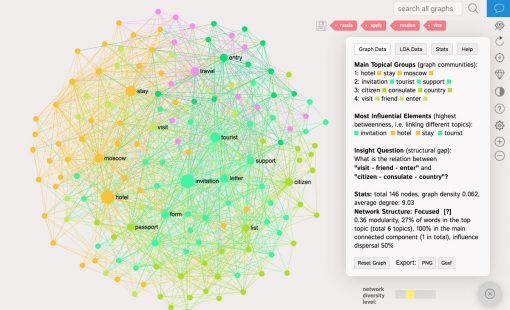
Brand association map for the customer feedback, containing all the terms and showing the context for each of them (the original graph can zoom in and out)
As we can see, the main feedback oscillates around “russian visa apply” and “russia” and “hotel”.
A great feature of InfraNodus is that allows you to remove the most popular terms, so you can peek behind the obvious (in this case, it is obvious the customers will use “russian visa” in their requests) and see what the customers really need when they are just about to leave the visa support request page and abandon the sales funnel.
In order to do that we simply click the popular terms and add them into the stop words (the icon at the top right). These are: “russian”, “russia”, “visa”, “apply” — these terms don’t provide any added value to the customer feedback as they just describe the context it’s coming from. We can, of course, play with the graph and remove some other stopwords if we want it to be more specific.
After removing the most obvious frequent words we get to the main topical clusters in customer feedback.
The analytics pane on the right identifies the following main topical groups for the customer feedback obtained using HotJar:
- hotel – stay – moscow
- invitation – tourist – support
- citizen – consulates – country
- visit – friend – enter
Clearly, the problems the clients are having when filling out the Russian visa support request form center around these 4 topics.
If you know the product, you will be very quick to identify what problems those topics represent. If you don’t, InfraNodus has a great feature where you can click the nodes and see the context they appear in. For example, for “hotel”, “moscow” and “stay” topic we have:
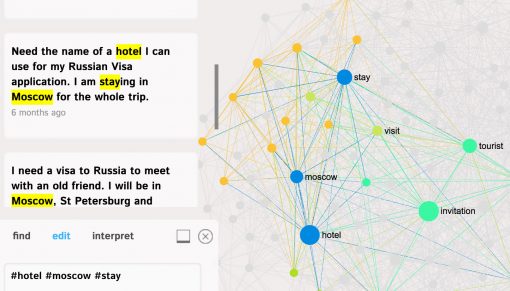
Clicking the top nodes in each topic we can see the context they appear in.
This identifies a common problem: the tourists have to provide the name of the hotel they’re staying in but sometimes they don’t know as it is not booked yet.
In order to address this problem we advised our client to provide additional information about these options above the visa request form, specifying that tourists can choose any hotel from the list as there is no law that obliges them to stay in the same hotel they specified in the invitation request form.
Another topical cluster is “visit”, “friend”, and “enter”. A quick analysis shows us that the customers are unsure what to do when they’re visiting a friend — do they need a tourist visa? do they need to book a hotel?
We advised our customer to provide additional information that would address these issues above the visa support request form.
Step 3: Evaluate the Results
After the changes recommended above were implemented into the production web site, we ran an A/B experiment to see if there were any improvements on the conversion rate for this sales funnel.
We had the following results:
- Conversion rate increased by 10% ;
- There were no more requests on the topics that we identified meaning they were addressed properly;
This shows that processing the customer feedback on funnel abandonment and addressing the issues identified can have a direct impact on the revenues.
To try InfraNodus in action, please, sign up on www.infranodus.com
