
Posted by Nodus Labs | October 1, 2023
How to Measure Heart Rate Variability (HRV) using Fractals
HRV or heart rate variability is one of the most important health markers that indicates how resilient and adaptive the body is. Most fitness trackers encourage their users to increase their HRV, however, the issue is much more complex and interesting than “the higher, the better”.
While an increased heart rate variability is linked to better health, the dynamics of how it changes are also very important. Multiple studies [1] [2] have shown that when this dynamics has fractal properties — that is, when the change is self-similar across different scales — the body is at its healthiest and most adaptive state. However, most of the popular trackers — from Apple Watch to Garmin — do not show this data. The heart rate variability charts below demonstrate the difference.
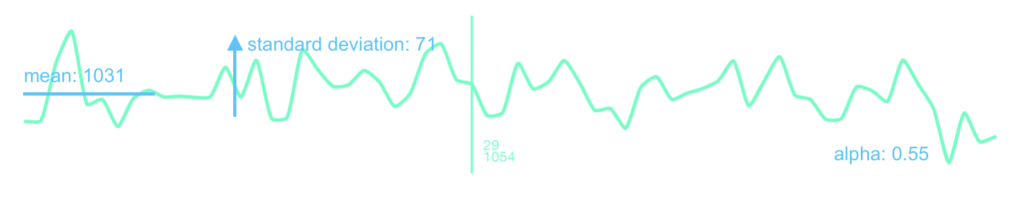
Figure 1: Random HRV graph (64 values, approximately 1 minute of observations). Oscillates around an average value (1031), every consecutive interval is unpredictable but within an expected range (+- 71 to the mean in approximately 68% of cases). SDNN (variability) value used by Apple Watch is at 71.
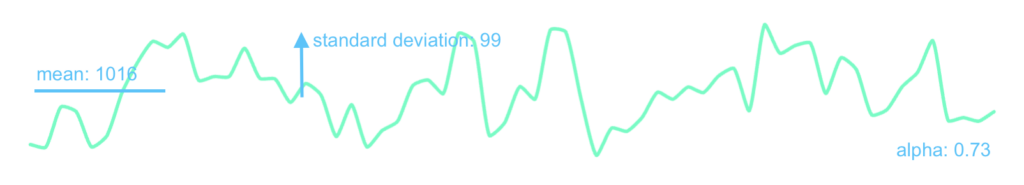
Figure 2: Regular HRV (64 values, 1 minute). Oscillates around an average (1016), every consecutive interval may be influence by the previous one: a small deviation is likely to be followed by a small one, a big deviation is likely to be followed by a bigger one, but not for too long. SDNN variability value used by Apple Watch is at 99 (very high), yet this pattern is not the most optimal and the most adaptive.
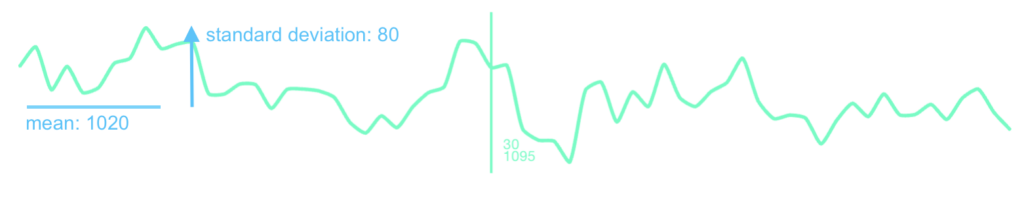
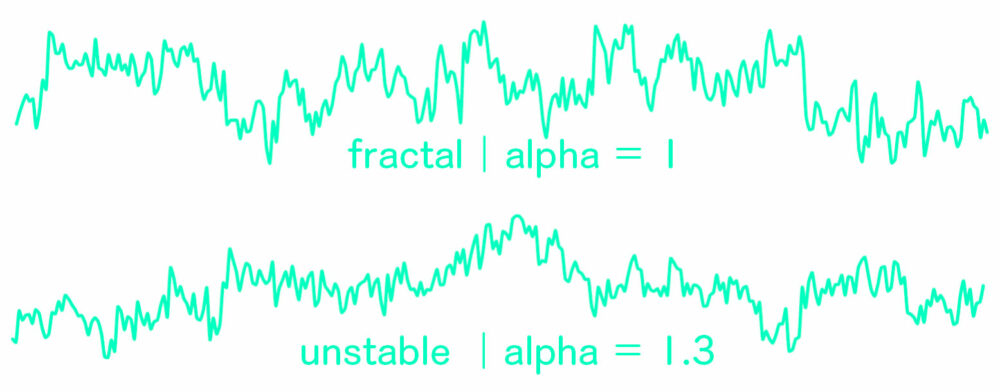
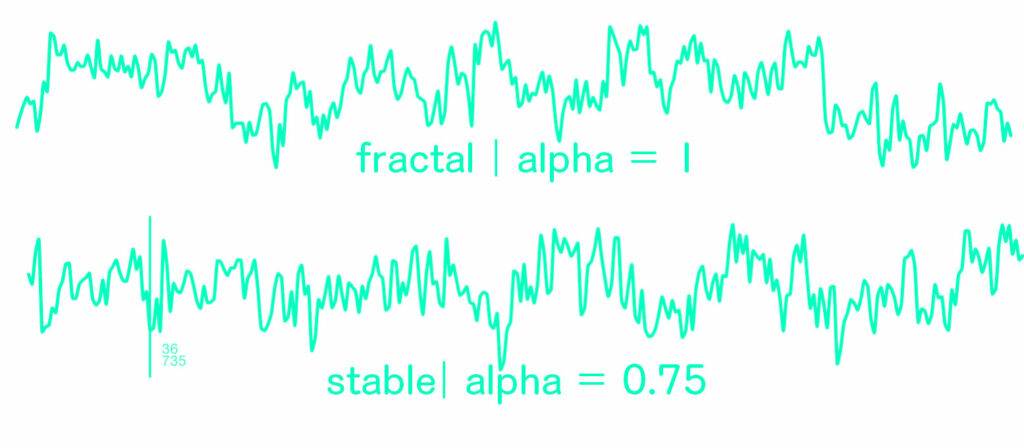
Figure 3: Fractal HRV (64 values, 1 minute). While the SDNN (HRV variability as measured by Apple Watch) is lower at 80, it is in fact the most optimal pattern of change because it combines short-term alternations with long-range ones. If we observe it for 10 seconds (zooming into the 1/6 of the graph) we will see a similar pattern of change (small – small – big – big – small) as the whole graph (small – big – small – small – big – big – small). This means there’s a relation between the short-term smaller fluctuations and the bigger, long-term ones, so the system is connected across different time scales and has memory. It is sensitive to both smaller and big perturbation and yet not overly reactive.
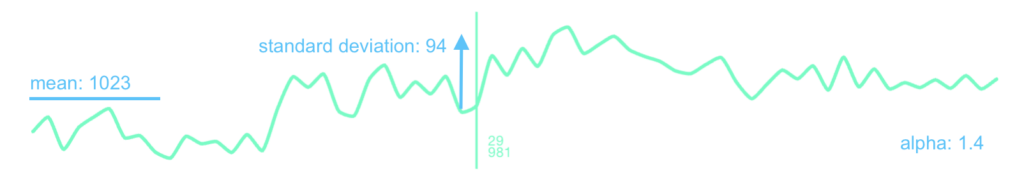
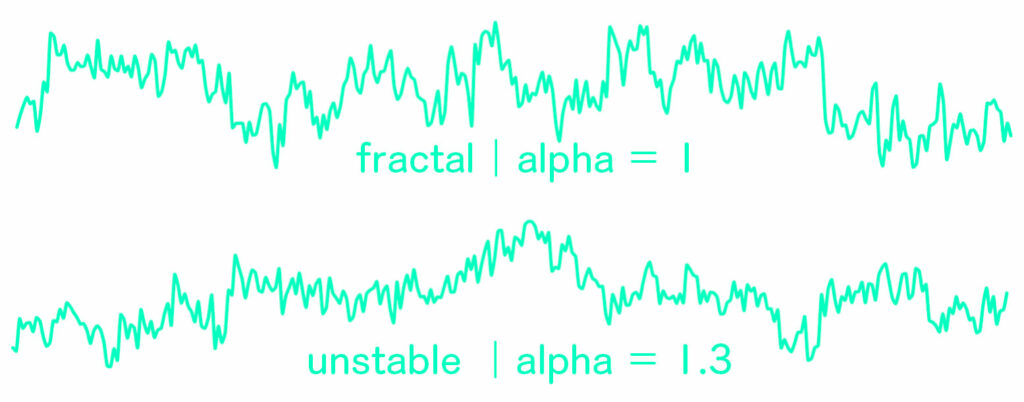
Figure 4: Unstable HRV (64 values, 1 minute). While it has one of the highest HRV value at 94 (as measured by SDNN Apple Watch measure), it is in fact not adaptive because as we see each consecutive change is quite small and there was a phase shift from shorter distances to the longer at 1/4 and 1/2 of the distance). This means that the system is overly sensitive to long-term influences at the expense of short-term ones.
…
Increasing HRV vs Fractal Variability
HRV is determined by the variations between heartbeats, known as RR intervals. Although our heart appears to beat at a consistent rhythm, there are minor millisecond fluctuations between each beat. For example, with a heartbeat rate of 60 bpm, there’s an average gap of 1000 ms between beats. However, the actual intervals can vary, with some beats closer together and others further apart.
If we build a chart of those differences we can see how high they are and also how they are changing. Most fitness trackers will only show you the “what”, but not the “how”. For instance, Apple Watch uses SDNN (standard deviation), which shows an average deviation from the mean in the time series. Oura Ring uses RMSSD, which is the root mean square of successive differences. However, this doesn’t tell the whole story. You might have a high HRV according to these measures, but if the fluctuations are oscillating around the same average value it may point to a pathology where your heart is not sensitive enough to all the different processes in the body, making your whole system less adaptive. Or — the contrary — if the average is constantly changing, it might be too sensitive to external influences, which also reduces its resilience.
According to numerous studies [3] [4], the “sweet spot” is actually in-between: your heart should be sensitive enough, but not too much. It should be responsive to both smaller, short-term, and bigger, long-term influences, both from inside the body and from the environment. This sensitivity can be described and detected mathematically using the so-called detrended fluctuation analysis (DFA).
The main parameter calculated by the DFA algorithm is the alpha coefficient [5], which indicates the level of correlation between short-term and long-term influences in a time series. If the alpha is around 0.5, variations in time series are more or less random. It is hard to predict the next value, however, over a period of time they oscillate around the mean. HRV with an alpha of 0.5 for a prolonged period of time would be considered unhealthy because it lacks complexity and adaptivity: no matter what’s going on inside or outside the body, its dynamic remains the same.
If the alpha is somewhere in the range of 0.6 to 0.9 it indicates that HRV starts to be more predictable. Both shorter and longer RR intervals will be clustered together, but only for a certain period of time. In other words, if the distance between the heartbeats starts to increase, it will stay increased for a while.
The same will happen if the distance decreases. This type of HRV dynamics indicates that our system is responsive to short-term influences (for example, decreasing your heart rate through breathing exercises).
Variations in HRV are explained through an intricate interplay between the sympathetic and parasympathetic nervous systems. The sympathetic nervous system is responsible for the “flight or fight” response and is the reactive part of the body that decreases HRV. The parasympathetic system is responsible for rest and relaxation and will increase the HRV. As both systems influence the heart, the variability between the heartbeats is changing. A higher HRV value indicates that those two types of influences are in constant interaction, making you ready to respond but also avoiding the constant stress.
Now, the state where the alpha — as calculated using the DFA algorithm — is below 1 and above 0.5 indicates that alternation between these influences has periodic properties. This is great, but not enough for adaptability and resilience: imagine you’re in your “relaxed” stage and need to respond to a violent impulse from the environment and suddenly shift to a mobilized state characterized by a faster heartbeat and smaller variability. Alternatively, there are also other processes in the body (hormonal, circadian changes), which should also affect the heartbeat on a longer scale.
Therefore, there’s an optimum value of alpha that equals 1, which indicates a special transitionary state where the rate of fluctuation change strikes a balance between predictability and responsiveness. The short-term patterns of change resemble the long-term ones. Practically, this means that if, say, in 10 seconds your HRV went a couple of times between shorter and longer fluctuations, then in 30 seconds you’ll observe a similar change but on a bigger scale: perhaps there’s a general decrease in the heart rate, so the distances become longer, followed by an increase, so the distances become shorter again.
That’s why this dynamic is called fractal: it’s self-similar across different time scales of observation. Whether you observe the heartbeat for a short time of a few seconds to a longer period of 2 minutes, you’ll notice similar patterns of change: oscillations between the beats will be reflected in the general dynamic of its change (faster / slower heartbeat). It’s like there’s a universal principle that is present on every scale, just like everywhere in nature: from how the trees are structures to how small-world social and brain networks are formed. This kind of structure, which has multiple co-existing states is known to be highly resilient and adaptive. Perhaps, this is why they dominated the evolutionary process and have become omnipresent in nature.
This understanding proposes an interesting link between the notions of “healthy” and “natural”, which gains objective dynamics thanks to the mathematics behind the DFA algorithm.
When the alpha component calculated using the DFA algorithm is above 1, this indicates a process that is too influenced by long-term perturbations and dominance of self-reinforcing feedback loops. This is another kind of pathology. If the low alpha HRV may indicate that our system is not sensitive enough to (and therefore not protected against) big impacts, then the high alpha HRV indicates a system that is overly sensitive and can be easily put off balance by big perturbations. It is no surprise that when applied to cryptocurrency market data, the DFA algorithm almost consistently yields an alpha higher than 1 providing an objective mathematical reflection of fads and sensitive crowd mentality.
…
HRV Fitness Trackers: from Quantity to Quality
We hope that we were able to show that to increase the accuracy of HRV readings, it is important to take into account not only the amount of variability but also its quality. Multiple Reddit posts ask about the low HRV or how to increase the measure. It is also important to be curious about this measure’s dynamic. The more fractal, or self-similar, HRV is, the more optimal is our state. The beauty of this logic hinges on the natural tendency of living systems to adapt to both small perturbations and big changes. To be sensitive enough to feel the nuance and yet also responsive to big perturbations. Something that we could definitely learn from our hearts and apply in everyday life.
While most fitness trackers optimize for the maximum value, real life is more complicated and interesting than that. There should be a tracker that optimizes for adaptivity and that does not always mean “the bigger, the better”, as we’ve shown in the previous paragraphs. It seems like it’s more precise to say that “a mix of the smaller and the bigger is better”. As a result of this research, we’re developing fitness trackers and software that can measure HRV fractality. We also use a similar approach in measuring variability of ideas propagation in our text network analysis tool InfraNodus.
…
If you would like to try our prototypes out, please, contact us via the Nodus Labs support portal.
…
References:
[1] Gronwald, Thomas, and Olaf Hoos. “Correlation Properties of Heart Rate Variability during Endurance Exercise: A Systematic Review.” Annals of Noninvasive Electrocardiology 25, no. 1 (2020): e12697. https://doi.org/10.1111/anec.12697.
[2] Constantinescu, V., D. Matei, V. Costache, D. Cuciureanu, and C. Arsenescu-Georgescu. “Linear and Nonlinear Parameters of Heart Rate Variability in Ischemic Stroke Patients.” Neurologia i Neurochirurgia Polska 52, no. 2 (2018): 194–206. https://doi.org/10.1016/j.pjnns.2017.10.002.
[3] Lin, Lian-Yu, Jiunn-Lee Lin, Chao-Cheng Du, Ling-Ping Lai, Yung-Zu Tseng, and Shoei K. Stephen Huang. “Reversal of Deteriorated Fractal Behavior of Heart Rate Variability by Beta-Blocker Therapy in Patients with Advanced Congestive Heart Failure.” Journal of Cardiovascular Electrophysiology 12, no. 1 (2001): 26–32. https://doi.org/10.1046/j.1540-8167.2001.00026.x.
[4] “Physiological Basis of Fractal Complexity Properties of Heart Rate Variability in Man – Francis – 2002 – The Journal of Physiology – Wiley Online Library.” Accessed October 1, 2023. https://physoc.onlinelibrary.wiley.com/doi/abs/10.1113/jphysiol.2001.013389.
[5] Xu, Limei, Plamen Ch. Ivanov, Kun Hu, Zhi Chen, Anna Carbone, and H. Eugene Stanley. “Quantifying Signals with Power-Law Correlations: A Comparative Study of Detrended Fluctuation Analysis and Detrended Moving Average Techniques.” Physical Review E 71, no. 5 (May 6, 2005): 051101. https://doi.org/10.1103/PhysRevE.71.051101.
