Posted by Nodus Labs | July 17, 2019
Gexf Viewer: Visualize and Share Gephi Graphs
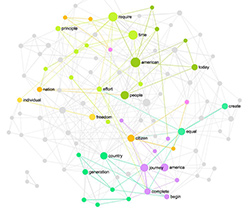
How to create or import a gexf graph file and to then share it with others as a URL or an iFrame embed.
How to create or import a gexf graph file and to then share it with others as a URL or an iFrame embed.
Network graphs are becoming a popular data visualization mediums. However, it is important to know how to read them in order to reap the most benefits from this kind of representation.
Excel was a revolutionary product for the time, but in the 21st century columns and rows are not sufficient anymore. What matters today are multidimensional relations between data, which combine a better view of the bigger picture with an attention to detail: networks and graphs.
Every year in December Vladimir Putin addresses the Russian Federal Assembly. His address is considered to be a good indicator of the current political mood in the country. Putin’s 2014 speech is especially interesting, because it concerns not only Russia but the whole world. We at Nodus Labs together with Way to Russai analyzed Vladimir Putin’s address made on the 4th of December 2014 using text network analysis and below we present a report on what we discovered. We also made a comparison of the 2014 speech to the 6 speeches before from the years 2008-2013 to see how presidential rhetorics evolved over time.
Text network analysis can be a very useful tool to make sense of Twitter’s ever-expanding newsfeed. It can be used to visualize a user’s feed of tweets or visualize one’s own newsfeed as a network to be able to see what the tweets are about and how they connect. Text network analysis allows to see not only the main terms, but also how they connect, providing the context to the most relevant keywords found on Twitter.

Special Agency Nodus Labs | 2015-2018 Creative Commons BY-NC-SA | Publications | Privacy Policy | Terms of Use
