
Posted by Nodus Labs | April 3, 2015
How to Connect your Ideas and Research Notes into Word Maps

Part of the research process is to generate ideas and to take notes, which are then used to build a coherent narrative. Over some time, however, there’s simply too much of disjointed bits and pieces of data and it gets harder to make sense out of them. In order to make research more efficient, we propose a methodology and an instrument to keep track of ideas, research notes and excerpts using network graph visualization.
Step 1: Get a Quick Overview
The first step is to get a quick overview of all the notes and ideas you have.
Traditional notepads and Evernote doesn’t really do the job, because once you have more than a few notes there is no way to know what they are all about. You might use tags, of course, but the existing tag clouds do not show you the context, making it much harder to know what you’re looking for and to find it.
We propose instead to think of every note / idea as a constellation of concepts / words that are connected. We then represent them as a graph where the words are the nodes and their co-occurrences are the connections between them. This can be done using InfraNodus’ bookmarklet feature: you simply select the bits and pieces of text you find interesting and add them into the graph. You can also add your own notes, of course:
Once we add a few notes this way into the same graph patterns will begin to emerge. For example, some words – across many different notes – will tend to co-occur together and we will be seeing clusters. Those clusters identify the topics that are present in a variety of our notes and the connections between the main terms in those topics. It’s like seeing a tag cloud, but instead of visualizing only the most popular keywords you also show which of those keywords tend to occur in the same context, making it much easier to understand and to make sense of your data.
Here’s an example of the graph that we made with InfraNodus for a quick study on landscape reading model, priming, and co-occurrence graphs – the principles at the basis of our text network visualization approach.
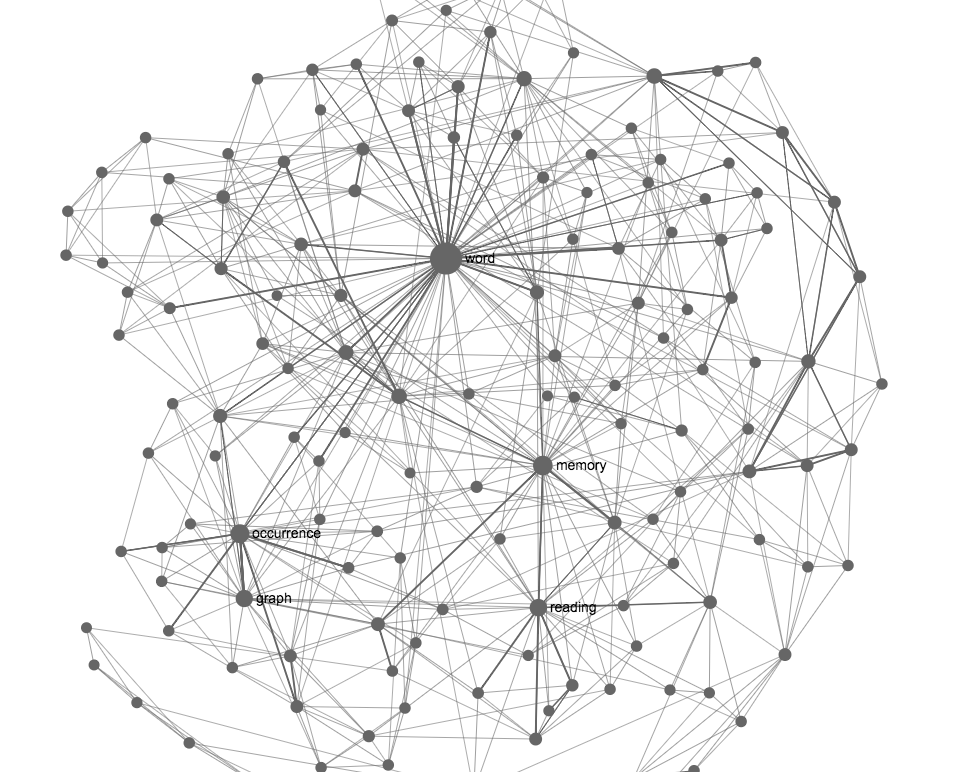
This graph contains a lot of notes and it helps you see very quickly that the main topics inside are about “memory and reading” and “(co)occurrence graph”. The advantage is not only that it makes it easier to remember it visually, but also that if we were to come back to this research after, say, one month, we would be able to quickly get back into the topic starting from the most prominent terms (we’ll show how this is done below).
Step 2: Find the Most Prominent Topics
The words that more often co-occur next to each other are shown closer and bigger on the graph. If you click those words (nodes), you will see only the notes and excerpts that contain all those words at once. This is a great and a very efficient way of searching.
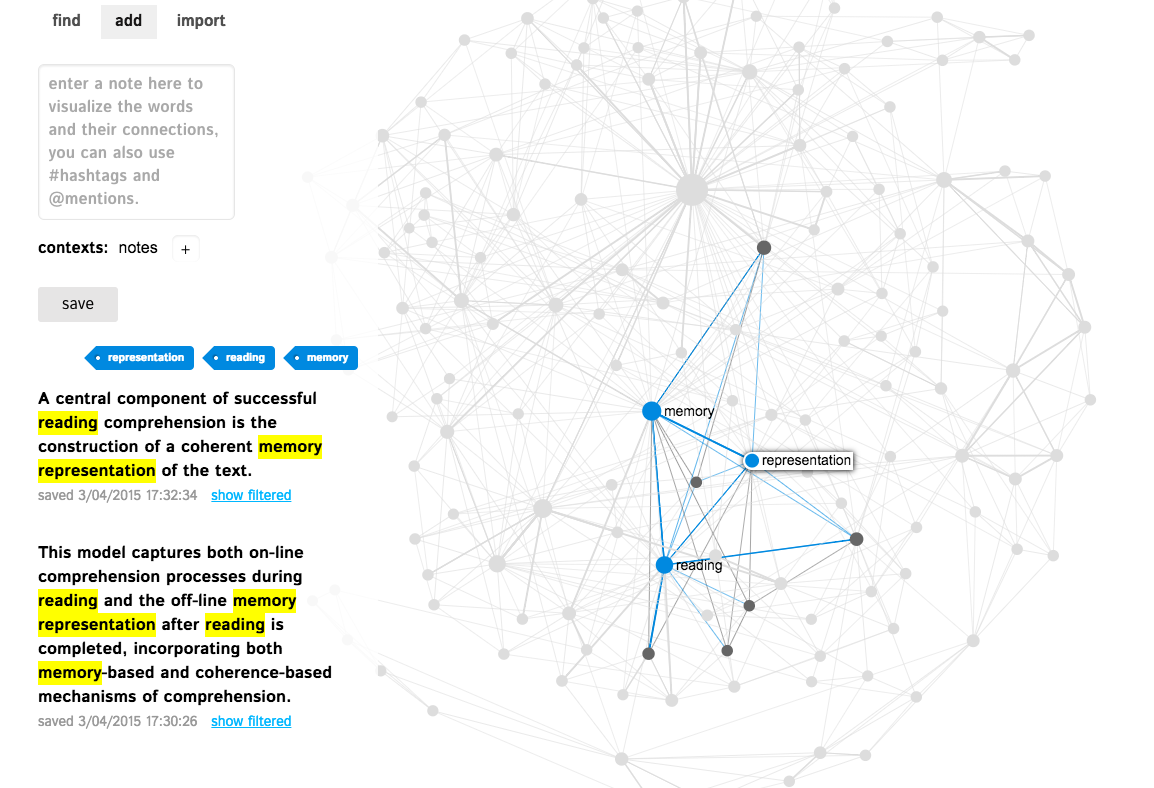
Instead of cold-starting your search struggling to remember what the whole graph is about, you can quickly see that in this case, for instance, there’s lots of notes and excerpts that have both “memory” and “priming” in them. Select them on the graph and you’ll quickly see all the statements that have those words co-occurring. Click on the link in the note and open the source web page from which this excerpt was extracted.
Step 3: Finding Something New – Filling the Gaps
We have shown above how the graph can be a useful tool to get an overview of your topic and to quickly access the information and sources you need.
The most useful feature of the graph, however, is that it shows what’s missing. By looking at the structural gaps in the graph, you know what questions to ask.
For example, we see that there’s one cluster with “memory” in it, another cluster is with “graph” and “co-occurrence”, and the node “word”. They are not all directly connected, so asking a question that connects them all together could lead to an interesting discovery. We can simply click those nodes and press the >> button and it will do a Google search for all of them, showing the pages that mention all of those words together. This usually leads to something interesting, but unexpected, so the graph can also be used as a recommender system based on serendipity.
Step 4: Try It Out!
Below is the interactive graph we’ve been using in this example. You can click on the nodes to see the text excerpts that contain the terms. Click on the >> button to search the terms you selected in the graph on Google.
Appendix: How Does It Work? Natural Language to Graphs.
The methodology we propose is based on converting natural language into a network graph. In order to obtain a meaningful graph, we take into account the cognitive processes related to reading, such as priming and landscape model.
At first, every note is converted into a graph where the words that co-occur next to each other (within a predetermined gap) are connected. Once a few notes are connected this way, you can gradually see the big picture emerging. We then can use Force-Atlas layout algorithm to group the words that co-occur more often together than with the rest and identify the most connected words ranging them bigger on the graph. Such representation of text allows us to see recurrent topics (clusters of nodes) present within the text, as well as identify the junctions for meaning circulation and identify the gaps between the clusters (that’s where the new ideas are!)
You can read more about this methodology in our research on text network analysis.
