
Posted by Nodus Labs | April 9, 2023
Personal Journal and Diary App with AI Text Analysis Features
In this case study, we will demonstrate the advantages of keeping a personal journal and diary using an AI-based text analysis app. Advanced text analysis capacities combined with GPT AI functionality can dramatically improve the ability to self-reflect and enhance a regular introspection practice. Tools, such as InfraNodus, make it possible to use journalling records to detect recurrent patterns of behavior, find out what’s missing, reveal the gaps in one’s life experience, and think of practical ways to bridge them.
Methodologies for Journalling and Keeping a Diary
The basic methodology for diary-keeping is to just write everything that happens on a daily basis. This provides a good chronological account of events, but it lacks categorization, which may be useful for defining the elements of one’s experience that need to be changed. Another popular approach is to keep a log of the things that you feel gratitude for, a so-called “gratitude journal”.
A more advanced way of keeping a diary is to separate the journaling process into separate parts. For example: what was good, what was bad, and what is lacking. This way, it is possible to separate positive and negative experiences and to also define whatever it is that is desired, but does not occur sufficiently. This approach can be very useful for mood tracking, except that you don’t just mark your mood but also describe what made you feel in a certain way so that gradually you can discover the correlations between your activities and emotional states.
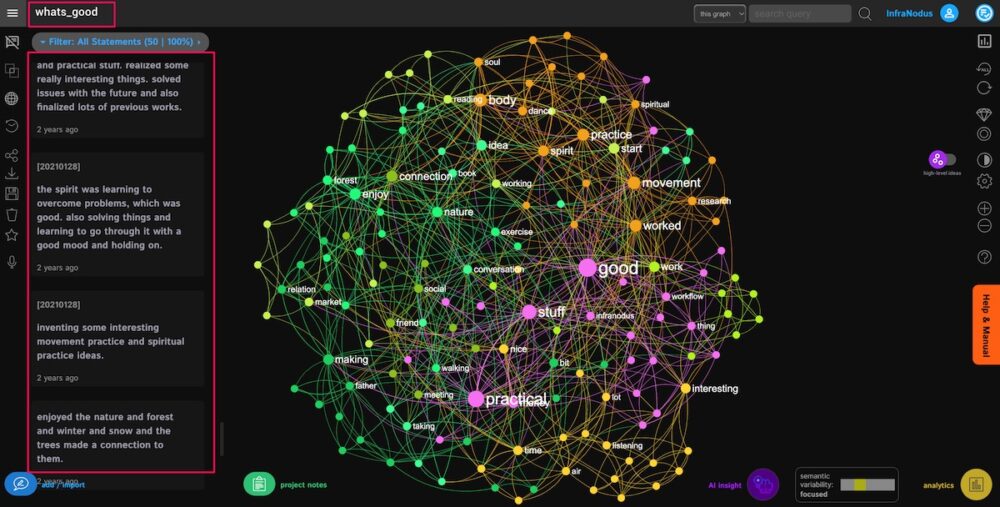
If you choose to keep your diary using any tool, you can simply separate your entries into 3 categories or use tags for each (e.g. “good”, “bad”, “lacking”). If you are using InfraNodus, you can write down your thoughts in 3 different contexts or use tags for each entry:

If you don’t have the graphs separated into parts, you can use the built-in sentiment detection algorithm in InfraNodus, which will rate your statements using the Bert AI model, so you can compare the positive and negative experiences anyway.
Another important aspect of any journalling practice is its regularity. Not only it ensures that the diary is active, but also helps avoid bias toward exceptional events. This way, we ensure that even if the day was not exceptional, we still log our feelings and thoughts, because they may become more relevant in another context.
Visualizing the “Positive” Diary Content
The first step is to visualize the diary content in order to reveal the main concepts and high-level ideas contained in each graph and to see whether there are some interesting patterns that come up.
If you use InfraNodus, your visualization is real-time. If you’re using any other tool for journaling, you can simply copy and paste the text data or use one of InfraNodus’ import plugins (e.g. from an Evernote notebook).
For instance, taking a personal diary of the author (data up to 2021), we will visualize the graph of positive experiences that occurred during a period of several months that the journal was kept and use the Text Analytics features of InfraNodus to reveal the main concepts, topical clusters, and patterns that come up in experiences that the author tagged as the positive ones:
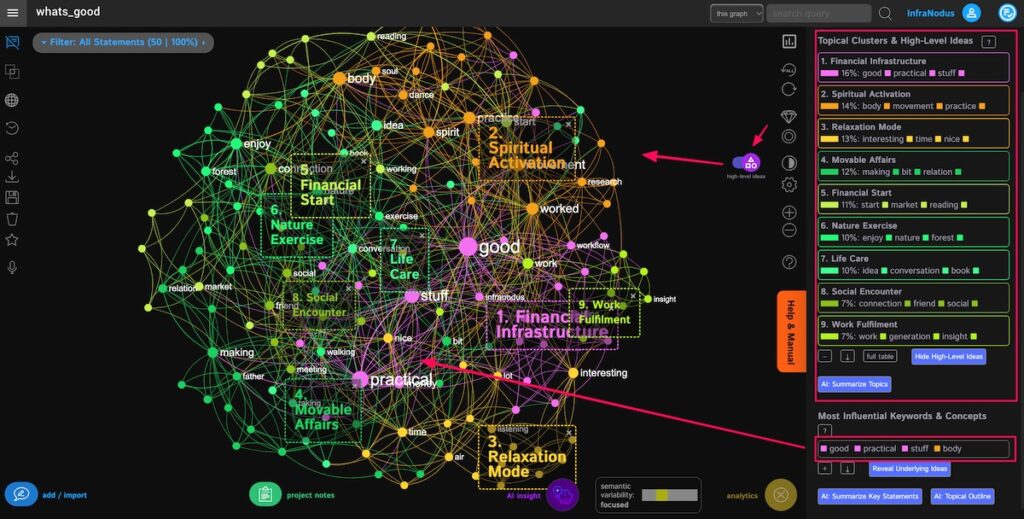
We can see that on the positive side, during the years 2020-2021, the author has been writing a lot about:
• financial infrastructure, money matters, and “practical stuff”
• spiritual and body movement practice
• relaxation and rest
• personal affairs
• nature and exercises
• caring about life
• social interactions
• fulfillment from work
This quick overview gives us a pretty good idea of what the author gave value to during this time and what contributes to his subjective well-being: basically, being good financially, finding time for spiritual and body practice, but also relaxation and rest, nature, social interaction, and work.
We can see that the percentage of nodes distributed in each topical cluster is more or less the same, which indicates that those topical clusters are equally important. However, upon closer inspection, we can also see that the “Thematic Diversity” score is on the “Medium” (Focused) level and there’s a tilt towards money and practical stuff, which may indicate excessive concern over financial practicalities during this period (perhaps, this was on everyone’s mind during Covid, yet, it is interesting to observe this over-compensation towards practical matters).
If we use this graph for self-reflection, we could simply realize two things: practical and financial stability are important to this person, but so are the social life, spiritual well-being, body movement, and nature, so it is important to keep all of those elements in life to be happy and to avoid letting practical concerns take too much hold.
Visualizing the “Negative” Diary Content
The second step is to do the same for the “negative” diary content so that we can reveal which patterns of thought came up during negatively rated experiences:
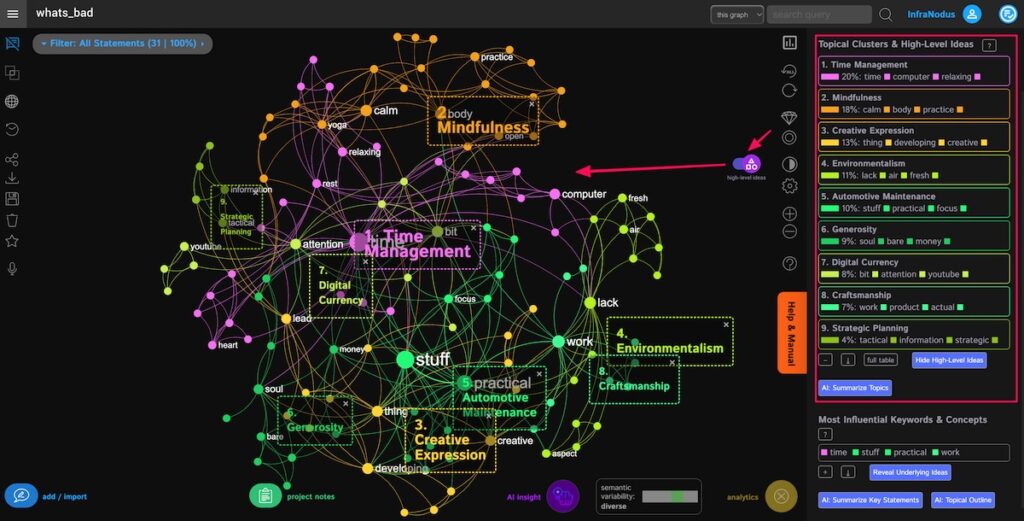
Using the text analytics panel, we can see that the main topics and patterns of thinking that came up in the “negative” context were about the following topics:
• time management (lack of time)
• lack of mindfulness
• lack of creative expression
• lack of fresh air and nature
• generosity
• craftmanship
• lack of strategy
These are all very useful elements for self-reflection. Combining them with the previous graph, we can see that there’s a problem with time management that should be addressed and also a lack of time for being mindful, working on the creative stuff, and being in nature. Indicating, perhaps, some sort of break in the life-work balance, especially if we combine it with the previous insight of being overly concerned about money.
Using Data Analysis and AI for Self-Transformation
Now that we have a graph of the positive and negative experiences and a basic understanding of what makes one happier, we can use those graphs to ideate on possible behavioral changes to achieve those results.
The basic approach that we promote is to use our ecological thinking framework when analyzing this data. The essence of this framework is to oscillate between different scales of perception (zooming out to see the big picture | zooming in to discover the nuance) and intent (constructing or making new connections | deconstructing, breaking connections, finding gaps between ideas). This framework is exemplified in InfraNodus’ Text Diagnostics Workflow, which you can follow to analyze your positive / negative experiences:
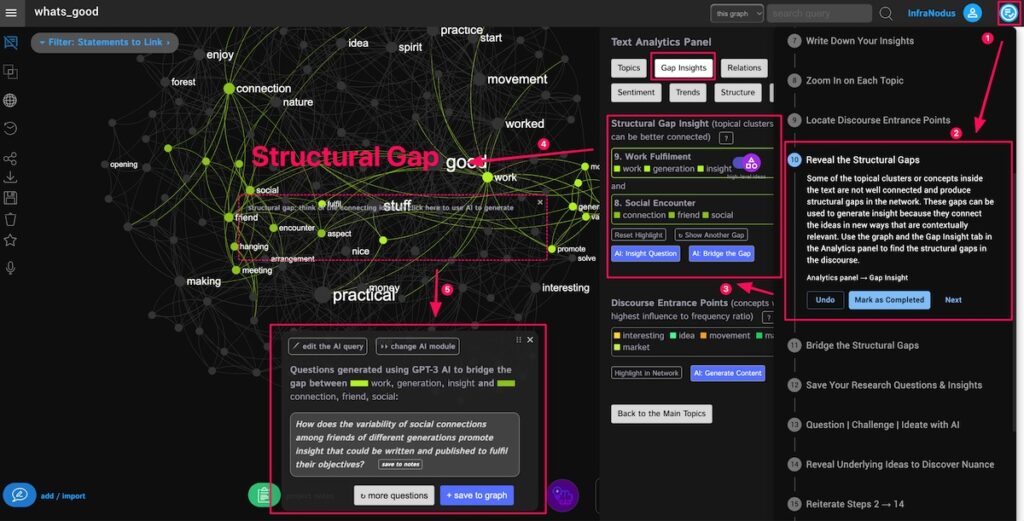
According to this workflow, we can use the graph to reveal the structural gap in our discourse: recurring topical patterns that tend to come up in different contexts. In this case, those are:
• Work Fulfilment
• Social Interactions
This means that while those two aspects are important for well-being, they don’t tend to come up together, so it could be interesting to link them for some sort of synergy to emerge.
We can then think of a possible connection: for instance, it could be interesting to work together with people to increase one’s social engagement. We can also the built-in GPT-3 AI to generate a question that links those two topics for us: it proposes to think of increasing diversity of social interactions in order to improve the kind of insights you get during work. Both insights are quite interesting and easy to implement.
We can then use more built-in tools and workflow elements to enrich our understanding of what’s good and what needs to be done to enhance our life experience. The advantage of having a graph representation is that it can be used like a mirror. Our research has shown that network representation helps people connect ideas. Various AI tools can further advance this tendency by proposing concrete connections and gaps that can be bridged to generate insight into one’s life.
…
If you would like to try this approach, please, sign up for a free InfraNodus account. You can also learn more about using the network graphs for introspection in our article on self-introspection using AI tools. This case study is also available as a step-by-step tutorial to journal and diary analysis on InfraNodus.
