
Posted by Nodus Labs | October 2, 2018
Text Network Visualization of Video Subtitles
Online videos, MOOCs, TED talks is a popular format for learning new things. However, it’s not always easy to get to the most relevant part of the video: if a lecture is more than 15 minutes long, the only way is to skim through, but it’s not reliable. That’s why we developed a special tool, which can visualize the subtitles of any YouTube video as a graph. Using this graph viewers can have a general overview of what the video is about, including the main topics and the relations between them. They can click on a few keywords and quickly get to the part of the video where the lecturer is talking about that particular subject.
Below we explain how it works in more detail and you can also see this short video that explains the whole process:
Step 1: Getting a General Overview of the Video’s Content
First you need to find the video you’re interested in. In the example above we use one of the most popular TED talks of Ken Robinson on how “schools kill creativity”.
Copy the link and then sign in to http://infranodus.com and then choose “YouTube Import” option in the Apps. Paste the link there and click “Go”. The software gets the subtitle file from the video (if it’s not transcribed manually then it’s the automatic translation, which is lower quality but it still works).
The subtitles then get visualized using our text network processing algorithm. The words are normalized, the stopwords are excluded, the main topical clusters are identified (indicated with different colors), the words that link those clusters together are shown bigger on the graph. As a result we obtain a pretty good representation of what the video is about in just a few seconds:
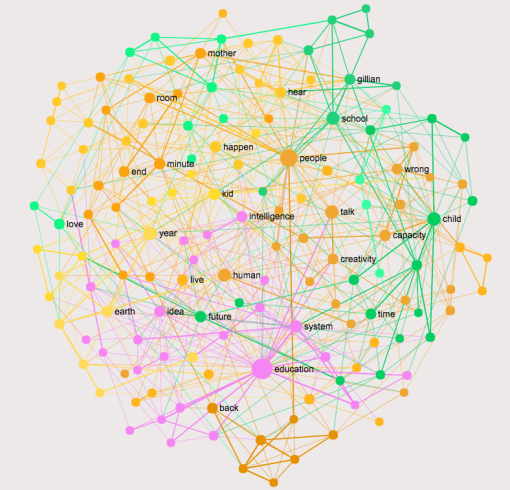
We can see that the main topics are:
education – system – idea
people – talk – human
hear – happen – woman
child – dance – future
The most influential words in this talk are
education – people – year – talk
Which gives a pretty good idea of what the talk is about.
Step 2: Get to the Part of the Video that is Interesting for You
Now we can use the graph interface to not only get a good overview of what the video is about and the main topics inside, but also to get to the parts of the video that we may be interested in.
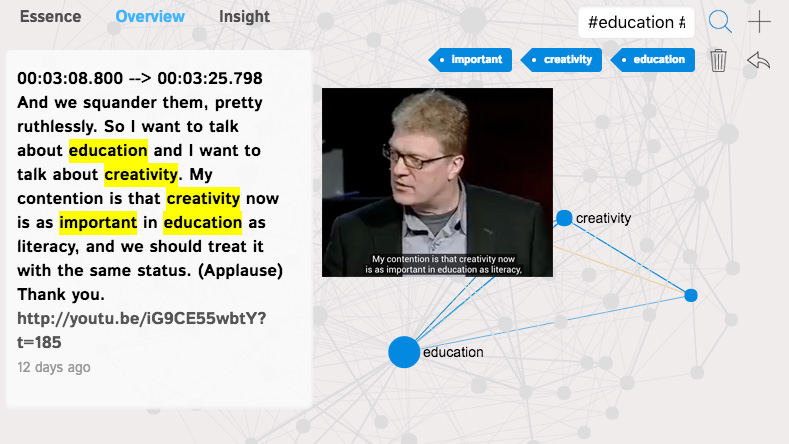
For example, if I click on
education, creativity and important
on the graph I will see the excerpt from the video, where the speaker is just talking about this stuff:
If I then click on the link of the video in that statement, we will get directly to the part of the video (timecoded) where he’s talking about this: http://youtu.be/iG9CE55wbtY?t=185
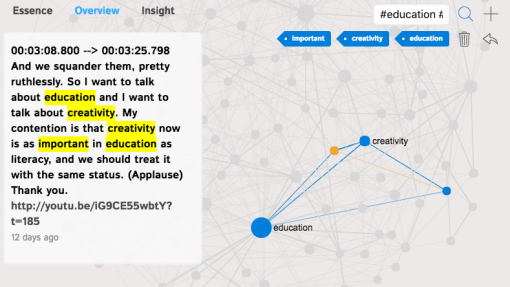
This offers a new way to watch videos in a non-linear way, focusing on the important concepts, which can be a huge time-saver in the context of informational overload.
You can actually try it yourself using this embedded graph below:
Step 3: Getting the Most Essential Parts of the Video Quickly
If you don’t feel like interacting with a graph, you can also get to the most essential parts of the video using the “Essence” tab at the top left.
The way the algorithm works is that it selects the parts of the video that have the highest concentration of the main words for each topic and aligns them chronologically. So if you watch 4-5 of these excerpts, 15 seconds each, you’ll have a good understanding of what the video is about.
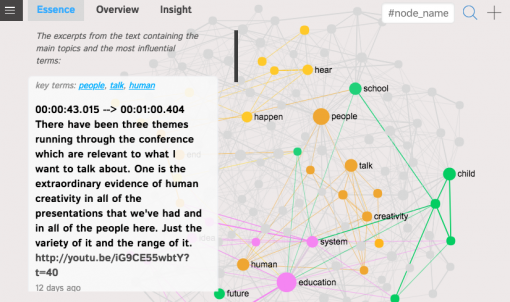
This feature is pretty cool, because instead of watching a 20-minute long video or skimming through it randomly, you can now skim in a much more efficient way in a matter of seconds. The algorithm chooses the main junctions for meaning circulation and helps you get to the parts of the video, which are most relevant for the discourse formation.
You can try this with several popular TED talk videos we visualized below to see how it works. Just open the page and click on the “Essence” tab at the top left corner and then follow the timecoded YouTube links from each statement to get to the relevant parts of the videos:
• What makes a good life? Lessons from the longest study on happiness by Robert Waldinger (video)
• The Power of Introverts by Susan Cain (video)
• 10 Ways to Have a Better Conversation by Celeste Headlee (video)
Step 4: Using the Text Graph as a Recommender System
Usually recommender systems work on the basis of similarity — “people who liked the video you like also like…” This method works pretty well, but it suffers from popularity bias and may lock viewers into filter bubbles.
A solution for this is to develop recommender systems that work on a different basis or to provide more tools to the consumers, so they can perform a search based on a different kind of logic.
We have a built-in recommender system in InfraNodus. When you click on certain nodes, you can open the Analytics pane and choose “Related Texts”. You will then be brought to the page, which finds the texts that contain the terms you selected:
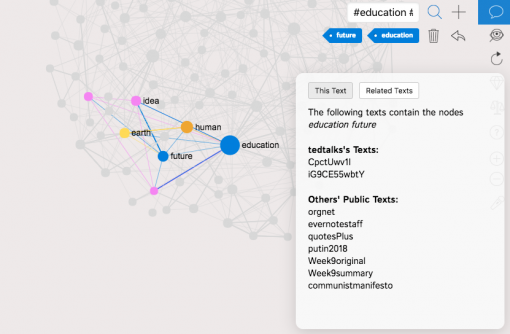
In the example above we clicked on “education” and “future” in Ken Robinson’s talk and that recommends us another talk that has the same terms included: “Why we do what we do” by Tony Robbins — in fact, if the terms are used in the same context we will see the parts of the video, which will only talk about these notions we’re interested in.
This offers us a completely new way of navigating through sets of videos, where we don’t follow the playlists, but skim through a set of video following the terms that are relevant to us.
Step 5: Generating Ideas Using Text Network
Text network can be a great tool to generate new ideas. When we create a visualization we align the nodes that tend to appear in the same context as clusters in space. The structural gaps between those clusters indicate the parts of the discourse, which are underdeveloped.
You can get to those structural gaps if you click the “Insight” pane at the top left of the graph:
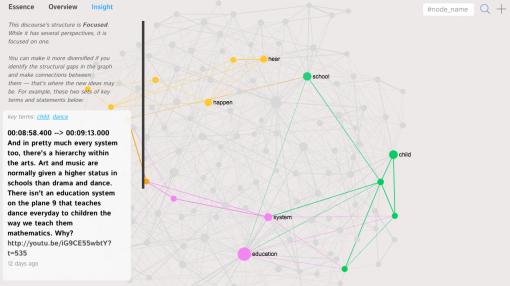
As you can see it shows the parts of the graph and the statements within the discourse that are prominent enough but are not really connected. So asking a question that links the two statements (or the two sets of keywords) together may lead to a novel idea that will still be relevant to the whole discourse.
