
Posted by Nodus Labs | October 13, 2018
Word Cloud Generator Based on Text Network Visualization

Word clouds provide a quick and visually appealing way to showcase textual content and they have been in use since the 90s. However, they lack precision, interactivity, and context. We developed a methodology and a tool called InfraNodus that can take word clouds to the next level, making them much more useful not only for visualization, but also for research and educational purposes.
The Problem with Word Clouds and Tag Clouds
Tag clouds were popularized some time in the 90s. Created at the dawn of informational overload they offered a convenient way to visually summarize a text (or a website) and to provide additional navigation. However, it became pretty apparent that they wouldn’t become a mainstream element of the web. While they do improve the process of search (study), word clouds are mainly used to provide supporting visual material for some other content. And while they are pretty good at it, there are still several problems.
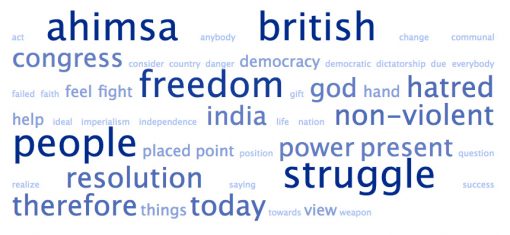
A tag cloud of Ghandi’s address made using TagCrowd.Com.
One problem is the lack of context. Most of the word clouds simply show the most popular tags ranged by their frequency (following tf–idf method), listed alphabetically. While such representation provides a general idea of what the text is about it omits important information about the different topics inside, their relationships, and the structure of the discourse. Some of this information can now be retrieved using various data mining tools (e.g. topic modeling), although complex probabilistic algorithms used in approaches like LDA or pLSA do not provide an easy and intuitive way to visualize this data.
Another problem is the use of tag cloud as an interface: it is convenient, but not as much as could have been. A tag cloud does not provide a way to navigate through a text. Even when the words are clickable, we simply end up performing a search on only one keyword losing important contextual information as a result. More than 60% of search queries contain more than one word (source) and even that one word is probably the name of a website, so it would only make sense to enable multiple-word search through tag clouds.
We talk in more detail about a problem with the standard word clouds in our post on generating tag clouds with a context.
Word Cloud 2.0 — The Technique & the Upgrade
Text network visualization techniques can help provide the much needed upgrade for word clouds. The basic approach used in text network analysis is to encode all the words as the nodes in the graph and their co-occurrences as the connections between them. These words / nodes and their connections are then plotted on a graph.
A so-called force-atlas layout should be applied to push the most connected nodes away from each other and to group the smaller nodes that are connected to them around the hubs. The size of the nodes can be ranged on the basis of degree or betweenness centrality, highlighting not only the words that are most frequent, but also the ones that appear most often between different topics. Finally, the different topics (node communities) are identified based on how densely the words in a topic are connected together.
Using the approach above we performed text network visualization on the same text as above using InfraNodus word cloud tool. The resulting visualization provides a very comprehensive visual overview of a text. It doesn’t only show the most influential words but also how they are related to one another and how they are grouped into distinct topics. A visualization made using the same text as above (Ghandi’s speech) using this method will look something like this:
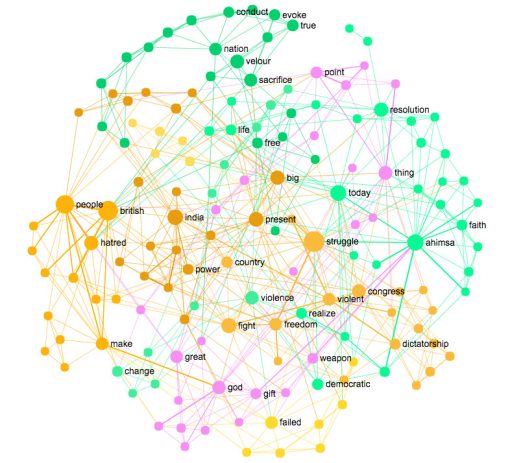
Text network visualization of the Ghandi’s speech made using InfraNodus.Com
We can see from this graph that there are several distinct topics inside this text:
british – people – hatred
ahimsa – today – resolution
nation – free – sacrifice
struggle – violent – freedom
The difference from the tag cloud is that we get a much better idea of the context and the dispositif of the whole text. It’s also possible to change the detail of the visualization and limit the number of nodes to about the same number used in tag clouds (40-60 terms).
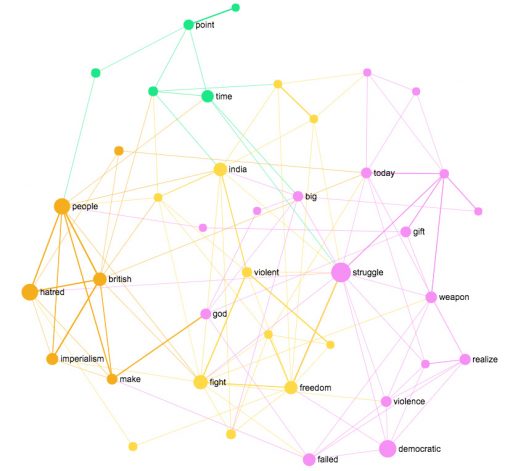
Word cloud created using InfraNodus text network analysis
The visualization itself can be used in printed or web publications to provide a quick overview of the main concepts. It can also be used in various presentations and studies to illustrate sentiment and provide deeper insights about the content of any textual data — be it customer reviews, marketing studies, scientific article abstracts or any other data.
Moreover, this type of visualization can also be used as an interface to search through text or to find new relevant articles. In the embedded graph below one can select several nodes / words to quickly get to the parts of the text that contain those terms. If you click on the magnifying glass button in the right pane you’ll be able to perform Google search on the nodes that were selected on the graph, exploring how you can develop the discourse further or get some new ideas from it.
