
Posted by Nodus Labs | September 7, 2018
Using Text Network Graph Visualization as a Musical Instrument
Text network visualizations are most often used to study and analyze data. However, how can an analytical tool become a musical instrument and what are the implications of that, both for the research process and for the creative work?
In this case study we will demonstrate how our text network graph visualization tool InfraNodus can be used in a live performance. We will show how its visual feedback system can serve as a generative tool for creating texts live. We will demonstrate how the visualization itself can be used as an interesting visual element during the show. Finally, we will show how InfraNodus can be connected to other musical devices trough the MIDI interface. It can then be used to send / receive MIDI signals to a synth or a drum machine in order to trigger sounds and sequences in them. The user — or operator — becomes a binding link between the sound (the music) and the image (the visualization). And language — what we actually used to input data — becomes the medium that connects it all together.
We consider this case study an interesting example of cross-contextual confluence: letting the different mediums influence each other. For example, a certain sound may generate an associative verbal response, which will then be visualized and through the relations that it produces will then influence the sound. The different mediums are now connected via a live feedback loop, destabilizing their borders and opening up to the new and the unexpected. The tools themselves are pushed to their limits because they now have to operate with the kind of data that is not usually available to them. The musical instruments and the network visualization software gain a sort of abstracted function outside of the context where they are usually applied. This enables us to see what happens when we “misuse” those tools and may help us develop them further, extending their applicative range.
1. How to Generate a Text Using a Graph
There are probably as many ways to approach writing as there are people. However, it also very much depends on the medium that we use and the feedback we get. If we look at the words that construct sentences we will be much more concerned with the meaning and the narrative. If we write poetry, the feedback we get is less about the meaning and more about the alignment of words in space, the free associative flow.
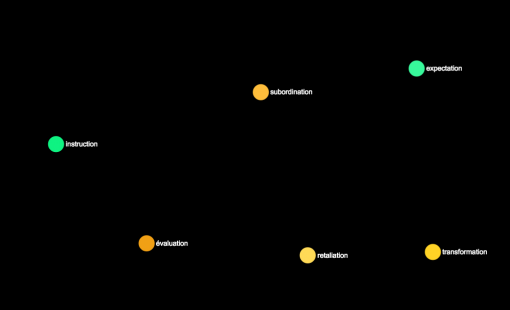
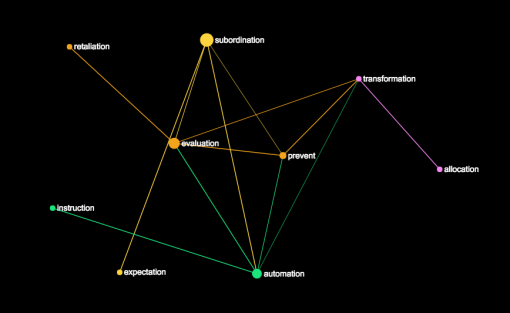
There is yet another way to write using graph visualization as the primary feedback mechanism. InfraNodus can be used as a tool to do just that. When we open an empty graph, we can start adding single words one after the other. They will appear as nodes in space, disconnected at first. What’s written at that point is more of an associative flow, a carcass of meaning, which does not yet reveal what the final shape could be. The words that are added may not have any relation to each other yet.
The next step is to start making connections between the words. For instance, in the example above we can link the pairs by saying:
expectation of subordination
evaluation of retaliation
allocation of transformation
automation of instruction
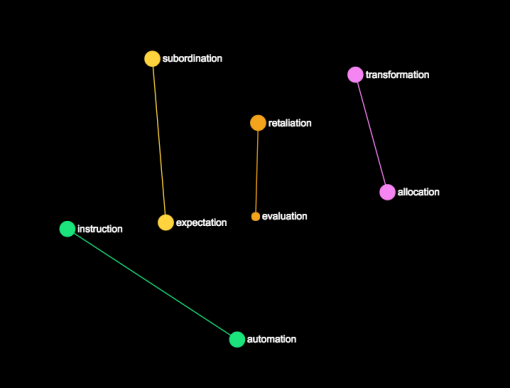
The new meanings are formed from the combination. We are witnessing the genesis of the narrative. A few more iterations and we will start having “meaningful” sentences, e.g.
“subordination of automation to evaluation is preventing the transformation” produces this graph:
… and so on.
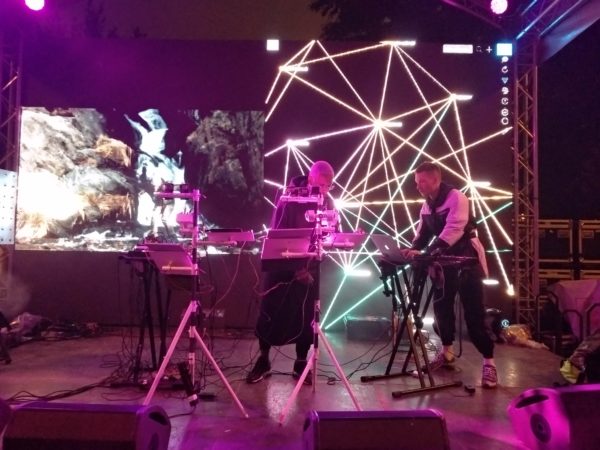
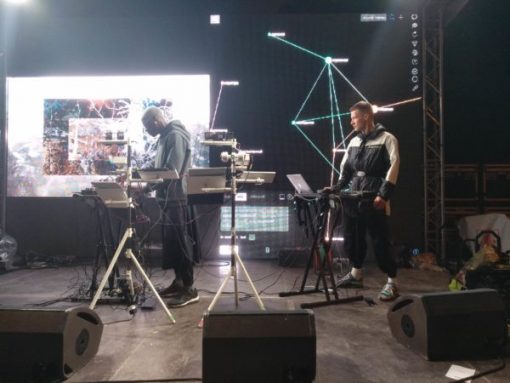
2. Creating the Visuals
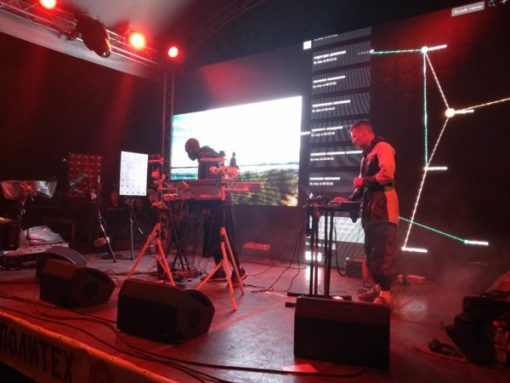
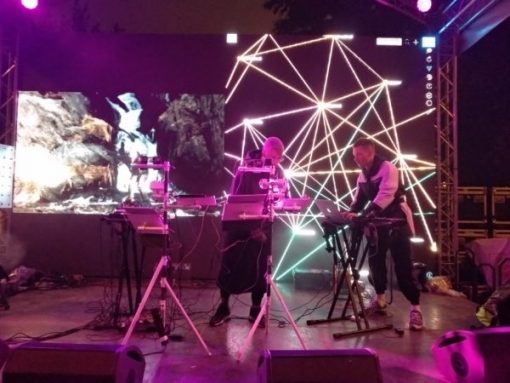
The visuals that are generated by the text network can be projected on a big screen or on split screen with another image. In a live performance we did with NSDOS at Polytech festival we projected the videos made in the nature on one side, and InfraNodus on the other. The words in the text network graph reflected was happening in the image, the structure of the visual representing the free associative flow of concepts and interpretations.
3. Plugging it into MIDI
The final stage was to activate the feedback loop between the image and the sound. We used a MIDI connection for that. InfraNodus has a setting, which activates MIDI input / output via USB. One can select the channels and the notes used. So every time a node and new connections are added into the graph, it will produce a set of of MIDI signals, which will feed into another musical device and produce a sound or a rhythmical pattern.
The same way round a musical device can send textual information to InfraNodus, visualizing the sounds as a graph, producing a soft of phase space network representation of rhythm and melody. In our example, the operator himself provides this link adding an interpretative layer on sound, which is then translated into a concept visualized on the graph.
4. Conclusion: Cross-Contextual Confluence
In this case study we demonstrated how the musical, the visual, and the conceptual can be unified into a feedback loop using various instruments and interfaces. This provides for a truly multimedia experience and proposes a kind of creative process, which is not limited by the mediums used. Rather, it is attempting to blur the borders between the mediums and emphasize the processes that happen inside, the inspirational flows from one representation to another as the driving force of a creative process.
