
Posted by Nodus Labs | July 24, 2015
Conference Talks Content Profiling Using Text Network Analysis
Any conference consists of multiple talks. Sometimes it’s hard to keep track of all the topics covered as most conferences only offer brief descriptions of each separate session. Also, most talks are categorized in thematical threads, but there is rarely an attempt to show how the different talks relate to one another, what are the most prominent topics that unify all of them, what are the differences between them.
Text network analysis can be very useful for solving these problems.
It offers a way of showing the most important keywords of each session through emphasizing the central conc<pts and their relations (so not only the most important keywords, but also how they relate to each other – i.e. the context).
Additionally, it can also be used to show the relations between the different sessions and talks, demonstrating how they relate to one another .
We did a case study at Durational Conference that took place in Berlin in June 2015.
1. Identifying the Main Topics of the Conference Talks
During the conference we asked the participants to write the keywords relevant for each talk using a collaborative portable whiteboard betabook. We then made a screenshot of each talk summary and put it into InfraNodus text network visualization software to get a general picture of how the talks were connected and what were the main topical clusters perceived by the audience.
A similar process could be made using established Twitter channels with a hashtag for each talk or conference – those Tweets could also be imported into InfraNodus to visualize the bigger picture.
For the purposes of text network analysis, the words (hashtags, keywords) submitted are represented as nodes and their co-occurrences are represented as the connections between them. The words that tend to co-occur more often together are organized in clusters, the keywords that appear more often are shown bigger in the graph. The more central the nodes are positioned, the more integrated they are in relation to the rest of the network (see more on graph interpretation techniques).
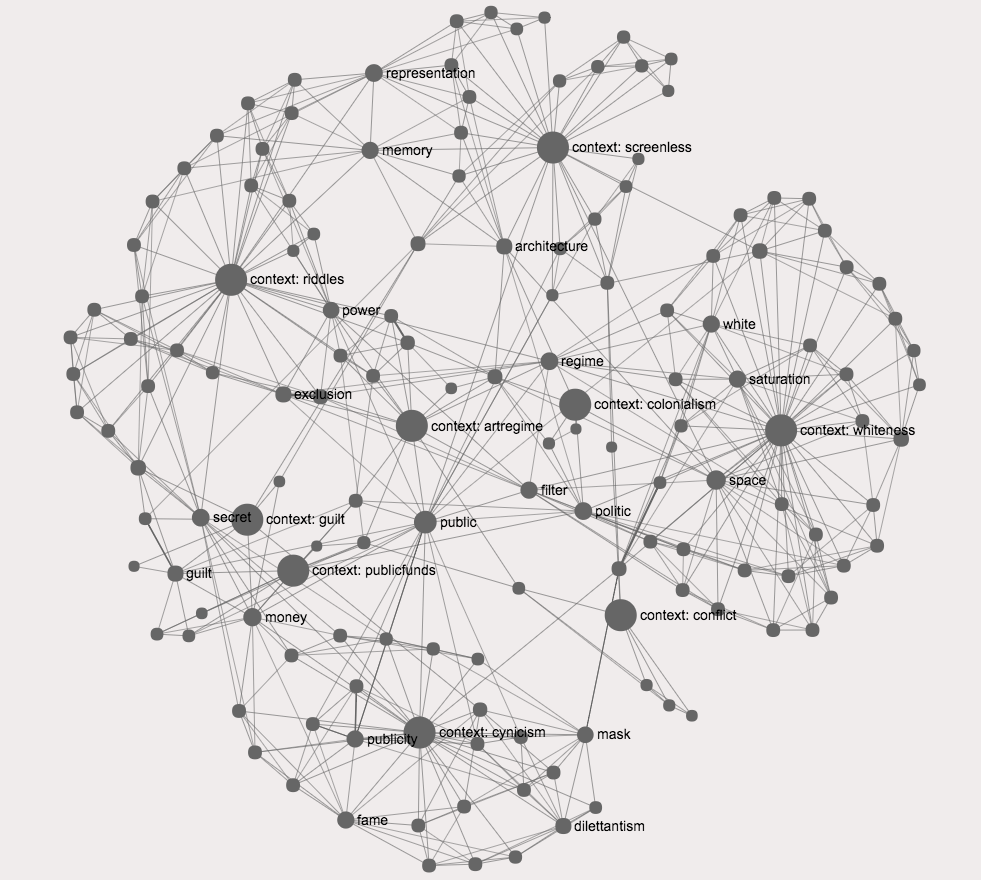
As a result, text network visualization of all the conference talks looks like this:

As can be seen from the visualization above, according to the participants the main topics covered during the conference had to do with
– public
– exclusion/inclusion mechanisms of power
– regime
These were the topics that were the most central to the conference, which meant that several sessions dealt with them)
– money
– mask and fame
– saturation, space, reflection
– representation and memory
– politics
– excess
The above are the topics that were more specific to particular sessions.
It’s also interesting to note that the graph structure is quite interconnected meaning that most of the talks were related through the main topics. Yet, this graph structure also has distinct topical clusters, which means that some talks were dealing with different issues than the rest, bringing diversity into the conference, making it more interdisciplinary.
2. Finding Which Conference Talks are Related
Text network analysis does not only help to discover the main topics of the conference talks. It can also demonstrate which talks are closely related to one another.
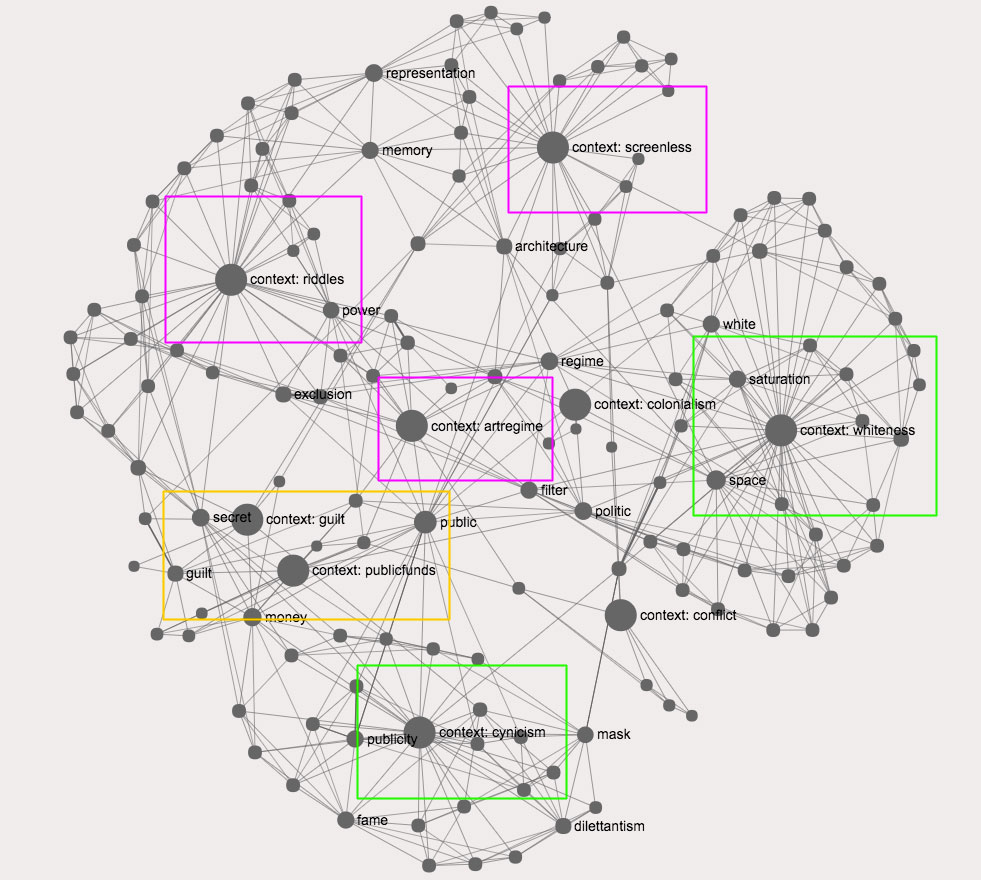
The nature of graph layout algorithm aligns nodes that are closely related or that are connected through other nodes close to each other. Therefore, if we add the actual conference sessions into the graph above, we can see which were of the sessions were most closely related and – also – which topics those sessions were dealing with:
As it can be seen above, the two sessions on “guilt” and “public funding” were closely related (mainly because they elicited similar thoughts in the audience, probably because one happened after the other, ).
Also, the sessions on “riddles” and “art regime” were connected through their common interest in the processes of inclusion / exclusion in relation to power (even though they dealt with very different subjects).
The session on “riddles” was also connected to the session on “screenless office” through the notions of memory and representation.
The sessions on “cynicism” and “whiteness” are on the periphery of the graph meaning that they proposed some topics that were unique to the general discourse of that conference. An interesting fact is that those two talks are also connected through the notion of “excess”, suggesting a potentially interesting point of further discussion between those two speakers.
The session on “colonialism” was quite central to the whole discourse mainly because it touched upon different topics present in other talks.
The session on “conflict” belongs to its own cluster and is not very well integrated into the rest of the conference’s discourse.
You can navigate through the interactive graph of the conference using the widget below. Clicking on nodes will show the parts of the conference talks that mention those concepts. Clicking on “context” nodes will show graph visualization of the actual talk:
3. Suggested Collaborations
Text network visualization can also show which speakers could benefit from collaborating.
The most obvious strategy would be to connect the sessions based on their topical proximity and similarity. The sessions on “guilt” and “public funding” seem to be very related above. Both the speakers and the participants could find it interesting to explore those two subjects together.
A less obvious strategy would be to identify the talks that have the highest betweenness centrality – connecting the different clusters together. For example, the talk on “riddles” was related to the talks on “art regime” and on “screenless office”, but those two are unrelated directly. So potentially the person who delivered the talk on “riddles” could be an interesting link to connect “art regime” and “screenless office” (strategy of resistance?).
Finally, a less common, but very resourceful strategy is to identify structural gaps in the graph – the areas between clusters that are sparsely connected or not connected at all. Those indicate high potential for new ideas and discoveries (read more in our article on the use of structural gaps for generating ideas).
In the graph above it is clearly the area between “whiteness” and “cynicism”. Those two sessions are only connected through the notion of excess but potentially could connect through many more notions – such as professionalism, cynicism, art context, galleries, etc.
Another the session on “conflict” is not very well integrated with the rest of the conference sessions, meaning that there’s a potentially interesting encounter with every one of them.
