
Posted by Nodus Labs | April 2, 2015
How to Write an Essay: Inspiration and Text Network Visualization
Anyone who has ever written an essay knows how difficult it can be to start. There are all the different ideas, various sources of information, some questions and threads… how to put all of this together? In this article we will demonstrate how text network visualization can be used to quickly make sense of disjointed bits and pieces of information, find the right questions, and transform all of this into a coherent essay.
Most of the advice on writing an essay focuses on having a defined topic and a clear paragraph structure (these are the main requirements for college and IELTS students). However, it’s equally important that the essay is not just a well-formed reiteration of the existing ideas, but, in fact, actually does something – otherwise nobody will be really interested in it.
For the TL;DR types here’s a short 2-minute video with an explanation, otherwise a more detailed step-by-step guide with pictures is below that explains in detail what happens at every stage.
Step 1: Creating a Map of Your Own Ideas
The first step can be to create a map of your own ideas. You can start yourself from asking “What am I interested in writing about?” For example, “How to write an essay” can be the the original subject and some of the ideas above are the first thoughts that we can visualize as a graph to help inspiration:
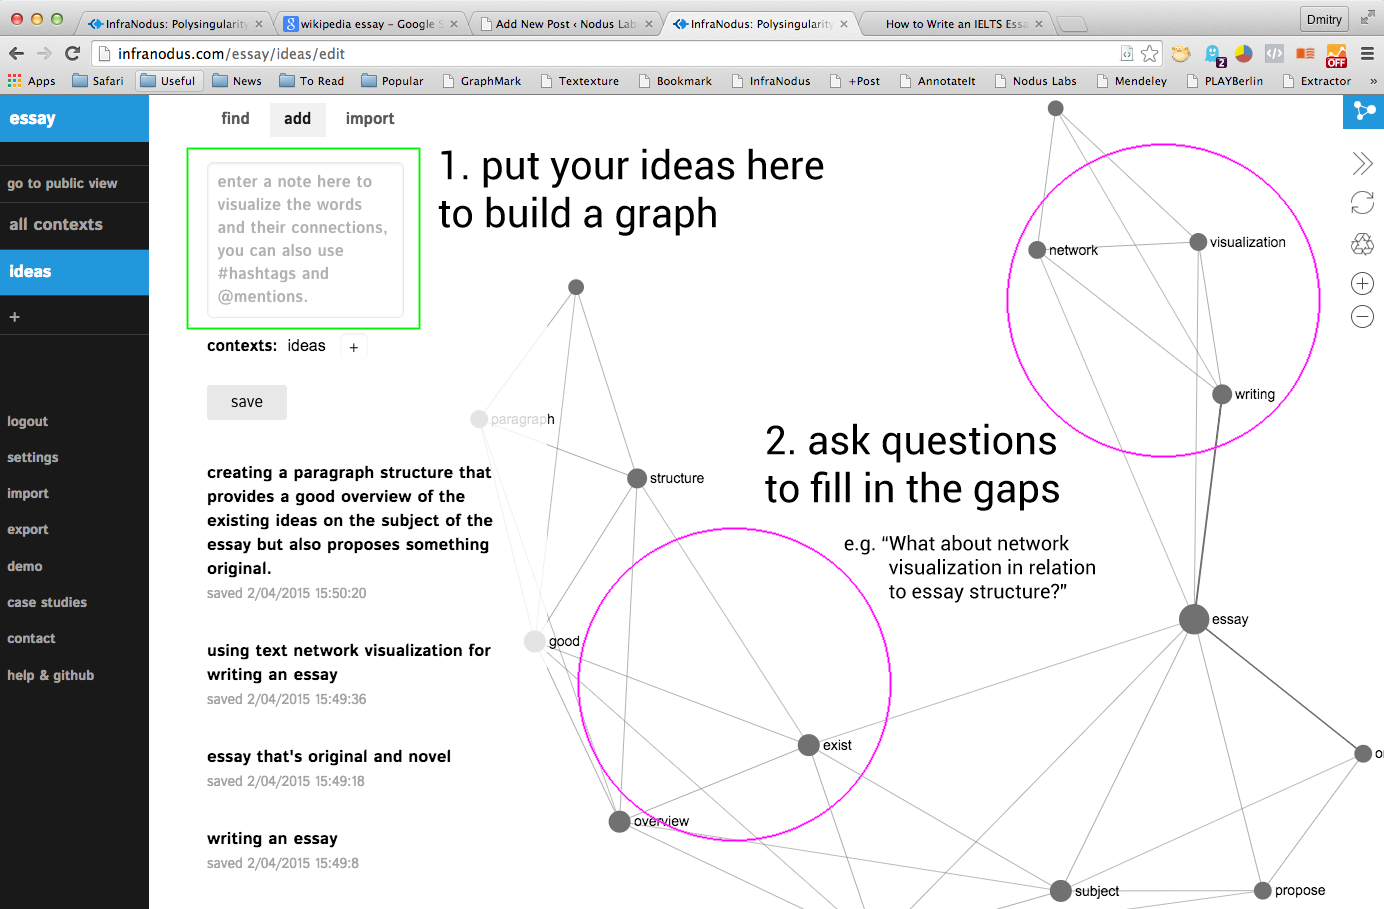
When we look at the graph above, we can see that there’s a gap between “text network visualization” cluster and “paragraph structure” cluster. So that’s an appropriate gap to fulfil by asking a question that attempts to connect them both. For example: “How text network visualization can be related to the paragraph structure?” Here we already demonstrate how a simple text network visualization can spur ideation process.
(We use open-source free InfraNodus software to create this graph. It visualizes your textual notes as a network and automatically shows where they are related and where they are disconnected (something that simple mind maps cannot do). You can of course also use a pen and a piece of paper for that purpose, but the software just makes it easier and faster.)
Step 2: Getting Inspiration
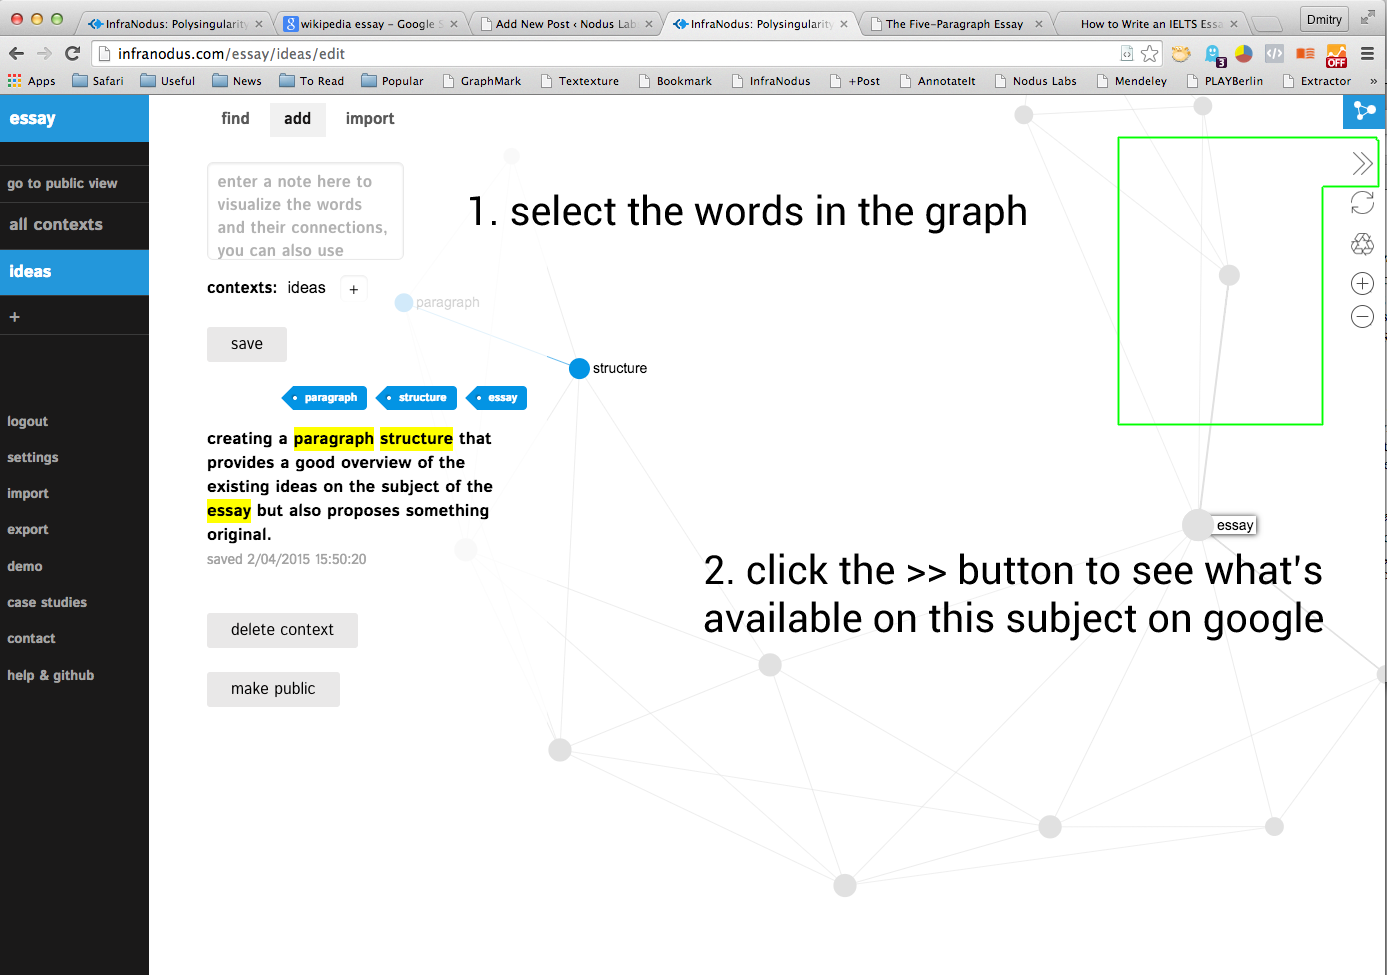
We now identified a gap in our ideas that we want to fulfil by asking a question. First, we can see what’s already available on “essay paragraph structure” on Google, just to know what the current discourse on that subject is about. If you’re using InfraNodus, you can select those words on the graph and click the >> button, so a new search window opens in a new tab.
In this case we selected “essay paragraph structure”, so the Google search results will show us all the posts that have those keywords together. We open the first result and come to an interesting page that talks about the essay paragraph structure, select the part that’s interesting, click “GraphMark” bookmarklet (or simply copy and paste the text into InfraNodus window), and add that excerpt to our graph, so we continue building our discursive “web”.
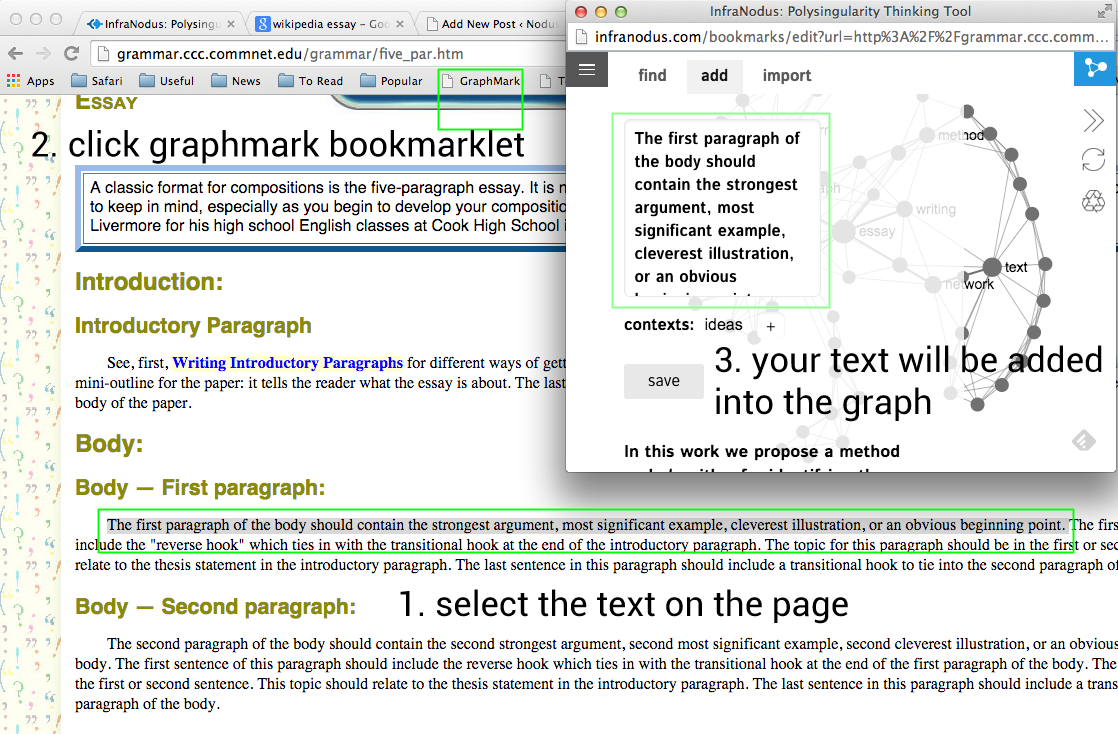
We can do this several times (copying and pasting the interesting excerpts from various pages on the internet)
We can then click on several nodes in the graph (or select a few more keywords) and see the actual note that we made that mentions all those keywords at the same time:
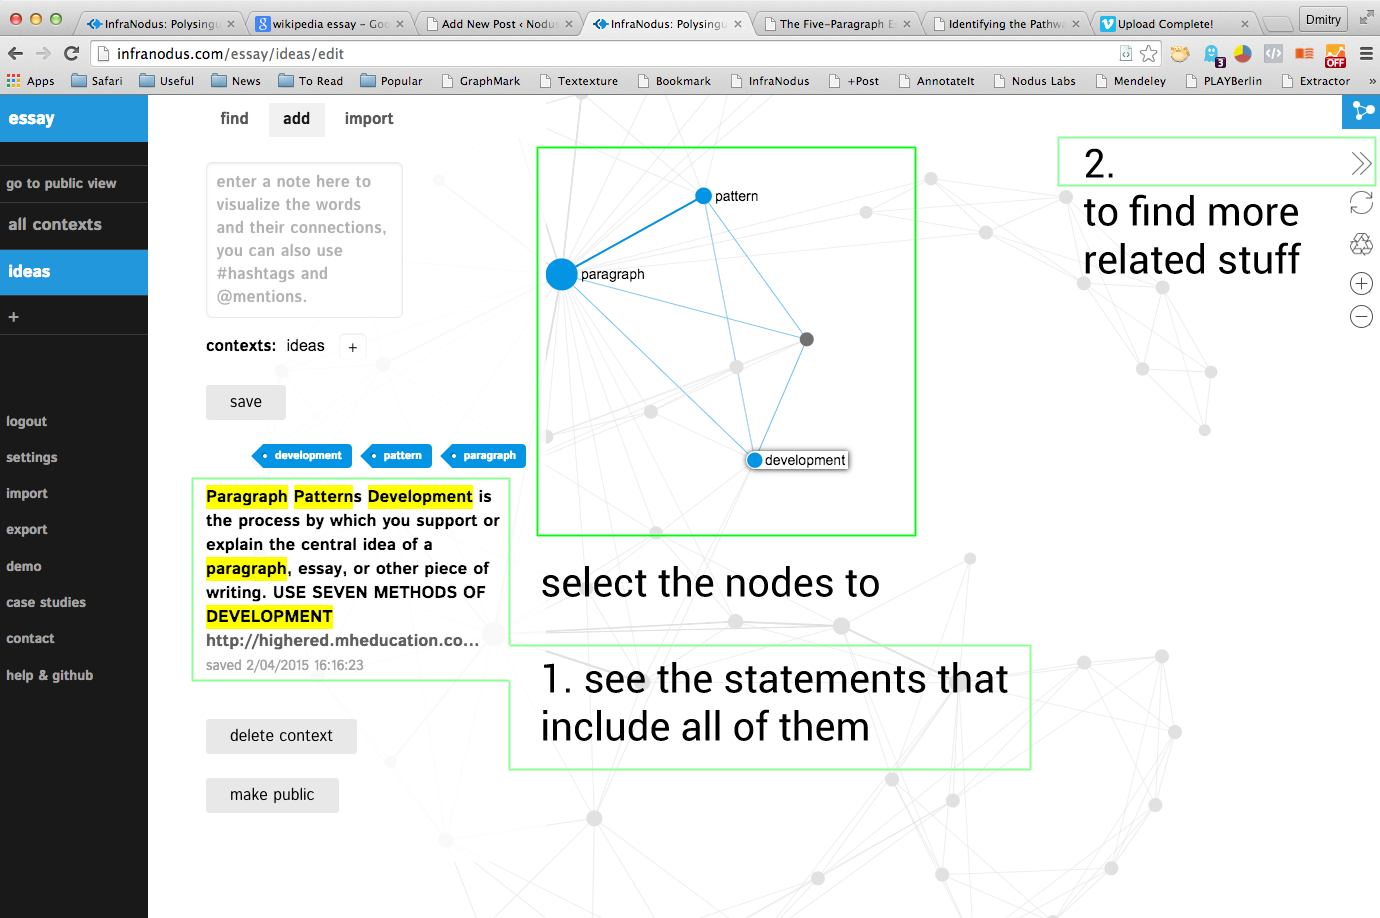
Clicking on >> lets us explore the topic further.
Step 3: Putting It All Together
Following the process above we will obtain a more or less complete graph that will have all the excerpts that we find interesting, showing how they are connected, what are the most prominent topics inside, and where there are gaps (those are the areas that indicate a potentially interesting question):
For instance, in the example above (and for the sake of this article) it could be interesting to relate “text network visualization” cluster to “paragraph structure patterns”. Specifically, we can explore how paragraph structure patterns can in fact be influenced by text network visualization.
The reason is that traditionally the recommendation is to develop an essay (or a paragraph) using one of the following approaches: narration, definition, description, classification, illustration, cause and effect. comparison/contrast. If we are to add something new to this discourse, we could mention that another approach, which is not so frequently mentioned, is to identify the gaps in the existing discourse and to then ask the questions that would attempt to bridge those gaps (what we’ve been doing so far in this example).
The main difference of this approach is that it focuses on asking questions and across the gaps and beyond the periphery of the existing body of knowledge we’re dealing with.
A standard narration or a description will simply identify what already exists. The interesting contribution that network approach can do to the essay writing process is that it provides a different point of view on the narrative, where you can see the whole text “at once”, and thus identify what might possibly be missing. This makes an essay not only informative but also inquisitive.
Appendix: Googling the Google
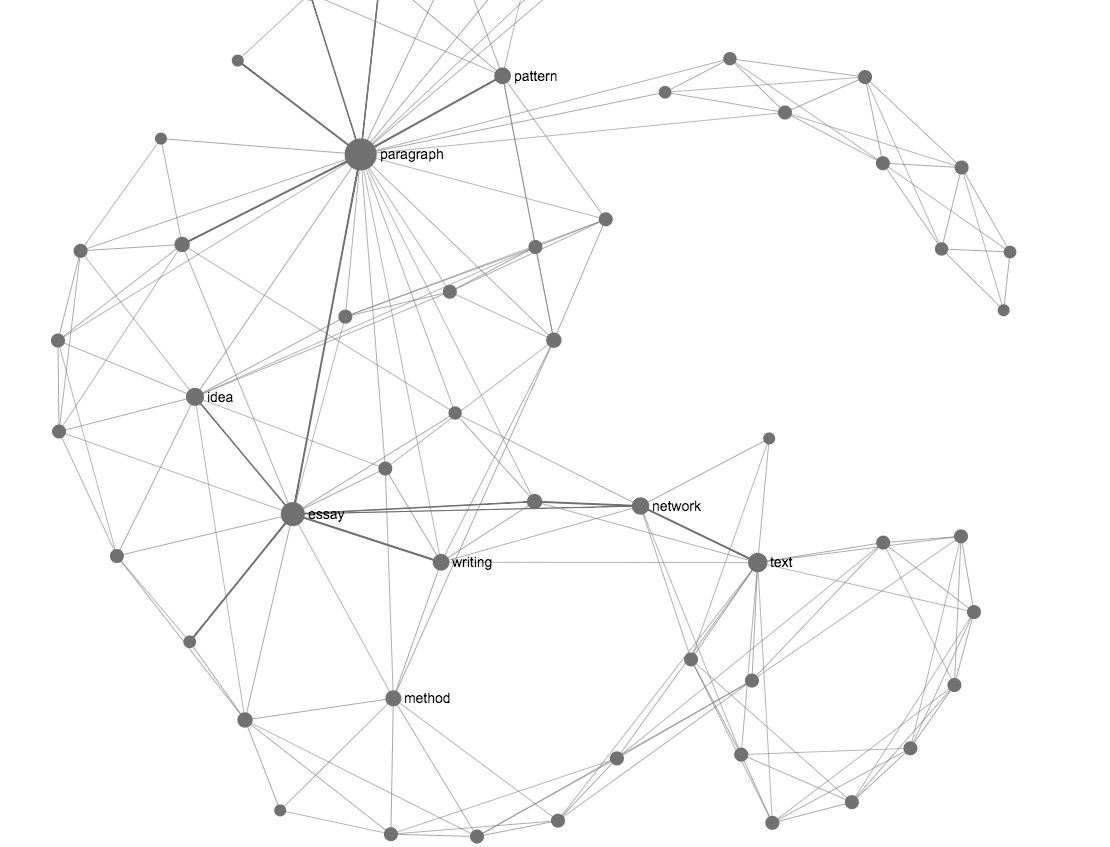
It may be interesting for some people to already quickly scan what’s available on the subject before writing about it. The advantage is that you are more likely to come up with something original and then it’s also more likely to appear in the search results. To perform this analysis, we will be using the keywords “writing an essay” or “how to write an essay”, and will look what’s already available on Google on this subject. In order to do that we can use InfraNodus Google search results visualization tool. It imports all the search results for the specified query and shows the graph of the most prominent words and their connections. Using this graph you can see what are the most prominent topics inside (the nodes that form clusters in the graph) and how they are related:

It can be seen above that most of the stuff you find on Google’s first two pages related to writing an essay can be separated into three different clusters:
a) “IELTS” and “sample” – search results that help write an essay specifically for English language tests
b) “tip” and “college” – tips for college students
c) “structure” and “paragraph” – the importance of paragraph structure
This very quick visual analysis of the search results yields a good picture of what’s already available on the subject and shows that the online discourse related to this query is geared towards students and is focused on structure advice mainly. Therefore, in order to contribute to this discussion in an interesting way, we may choose to cover those both subjects but also to introduce something new. In this case it would be a useful way for dealing with information and making sense of the data.
