
Posted by Nodus Labs | July 20, 2018
Google SEO Strategies using Text Mining and Network Visualization

Search engine optimization is a set of strategies used to promote certain content in search results. Using a combination of text mining and network visualization techniques, you can identify discrepancies between what the users search for and what they actually find. You can then create the content that bridges that gap, so that it’s shown at the top of the relevant search results. In this case study we explain the process step-by-step using InfraNodus text to network visualization tool.
Step 1: Identify the Relevant Search Queries
The first step is to identify the relevant search queries: what kind of audience we want to attract, what will they be searching for? How does it connect to our own work and interests and what our objectives are?
In this case study we will focus on the notion of “text mining” as the people who search for these terms are very likely to be interested in Nodus Labs’ products and services (especially the tools to process and better understand textual data).
We want the people who search for anything related to “text mining” to visit NodusLabs.Com and to find out about the novel text network visualization tools they can use in their work. In order to do that we need to create the content on text mining and network analysis, however, we first need to identify the semantic field related to this query, so that we better know what the audience needs, what they already get in their search results, and what’s missing.
Step 2: Visualize the Existing Google Search Results for the Search Terms
The next step is to get a better understanding of the kind of content that people get when they search for “text mining”.
In order to do that we can use InfraNodus SEO Keyword Research Tool, which imports the first 40 search results for a certain query in Google and visualizes the most important topics and the relations between them.
The way the algorithm works is described in the paper on Visualization of Text’s Polysingularity Using Network Analysis. In short, the words are represented as the nodes and their co-occurrences are the connections between them. Once we represent the text as a graph in this way, we can identify the communities (contexts) of nodes (words) that are used more often together (topics) and the most influential words inside the text for meaning circulation (we use the measure of betweenness centrality, which shows how often a word appears between different contexts present within the textual data.
If we use this algorithm to visualize Google search results for the search query “text mining” we get the following network graph visualization:
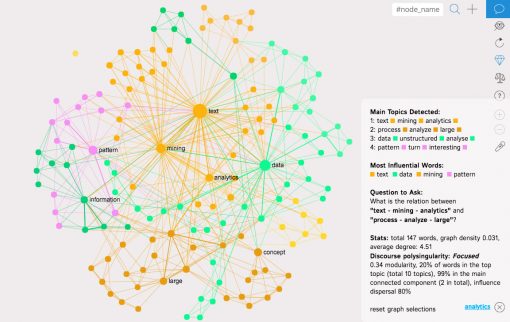
As we can see, when users search for “text mining” on Google they get the following topical clusters:
1) text – mining – analytics
2) process – analyze – large
3) data – unstructured – analyse
4) pattern – turn – interesting
So most of the content that is on the offer for this search query is related to processing large corpus of unstructured textual data and to discover patterns in this data.
We now have an idea what kind of content people get when they search for “text mining”, so now let’s see what they actually search for.
Step 3: Visualize Related Search Queries Using Google Adwords Keyword Planner Tool
The next step is to better understand what kind of information people need when they search for “text mining”. Google Adwords has a Keyword Planner Tool, which shows exactly that: the related search queries, so that we can better identify what our target audience really needs. Just type in the search query into the Keyword Planner (choose “Keyword Ideas”) and Google will show you all the queries associated with the original one:
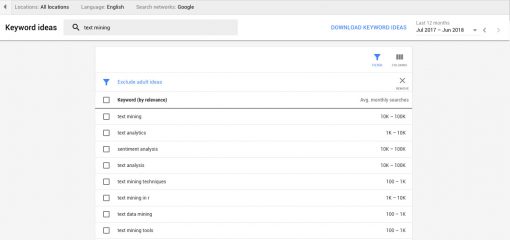
We can see that the people who search for “text mining” also search for
“text analytics”
“sentiment analysis”
“text analysis” and so on…
You can then click Download Keyword Ideas link in the Planner tool, which will create a CSV file. Open this CSV file in Google sheets, Open Office or Excel and copy the data in the first column, which lists all the different search queries and word combinations.
We will then paste it into a new context graph in InfraNodus and visualize it as a network, so we will be able to see which search queries related to “text mining” are the most prominent ones, how they are all connected, and the topics they form:
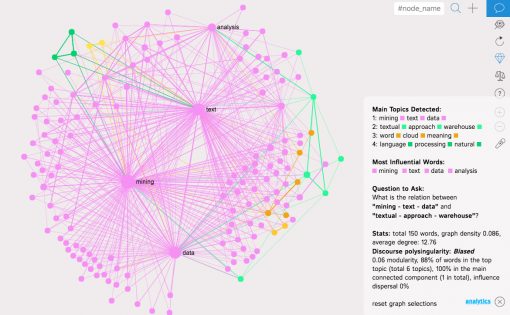
You can also use InfraNodus keyword research tool to compare the search results (informational supply) to the search queries (informational demand) and to find the gap between them.
As you can see from the graph the main terms are ” text”,=”” “mining”,=”” “data”=”” and=”” “analysis”,=”” rendering=”” all=”” other=”” ones=”” less=”” visible.=”” let’s=”” remove=”” them=”” from=”” the=”” graph,=”” so=”” we=”” can=”” identify=”” other,=”” obvious=”” terms,=”” that=”” are=”” related=”” to=”” “text=”” mining”=”” search=”” query.=”” in=”” order=”” do=”” that,=”” click=”” nodes=”” on=”” graph=”” (selecting=”” them)=”” then=”” “trash”=”” icon=”” next=”” add=”” into=”” stoplist=”” erase=”” graph:=””
Step 4: Compare Google Search Results Graph to the Keyword Association Graph
Compare it to the previous graph of the Google search results (from Step 2) and you will see that “software tools” and “techniques” were missing from what people see when they search for “text mining”.
Comparing two graphs together in InfraNodus we can clearly see that those terms are missing from the Google search results graph:
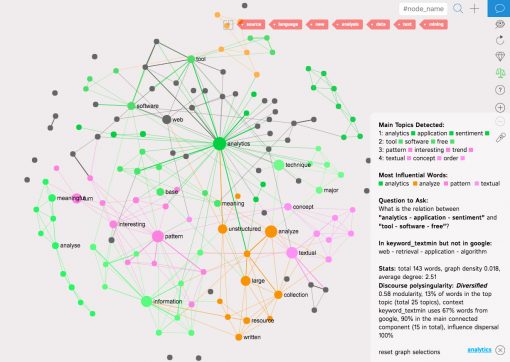
web — retrieval – application – algorithm
This analysis indicates that what people are looking for but what’s missing from search results in relation to “text mining” are some web-based retrieval applications and algorithm implementations that could be used for text data analysis.
We now discovered a potential gap in what’s searched for and what is being found as well as an interesting commercial opportunity in the field of “text mining”.
Step 5: Create New Content
We have identified the current lack in the field of “text mining”, so we can now create content that will fulfil this lack and propose innovative solutions to the field.
In our case we will be creating the content on “text mining” making a special emphasis on various software tools, including our own open source text to network visualization platform InfraNodus. This content will fulfil the current gap identified through analyzing search data on keywords, driving more users to NodusLabs.Com. Those users can then choose to try InfraNodus tools in their own work to test out a new method for text mining using network analysis and visualization, and, in turn, supporting the further development of this project by contributions.
