
Posted by Nodus Labs | July 2, 2021
How to Generate Word Clouds with a Context
When you generate a standard word cloud, it will normally not have any information about the context. The words will just be randomly aligned on the screen and the most frequently mentioned ones will be bigger and towards the center, while the less frequent words will be smaller on the periphery of the graph. This is a problem because a text is not just a combination of words, it’s all about the relations — and this information is lost.
However, there is a solution for that. Using InfraNodus word cloud generator, you can generate word clouds where the relevant terms will be aligned next to each other if they tend to appear in the same context. You will be able to see what are the main topics in any text and, more importantly, how they relate to each other.
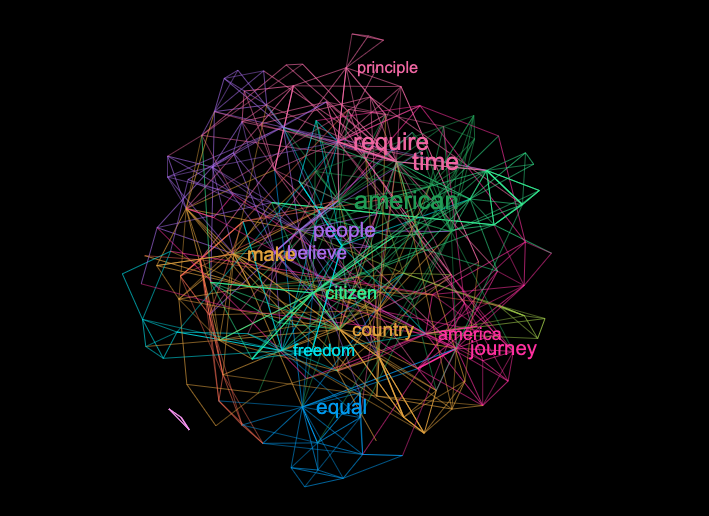
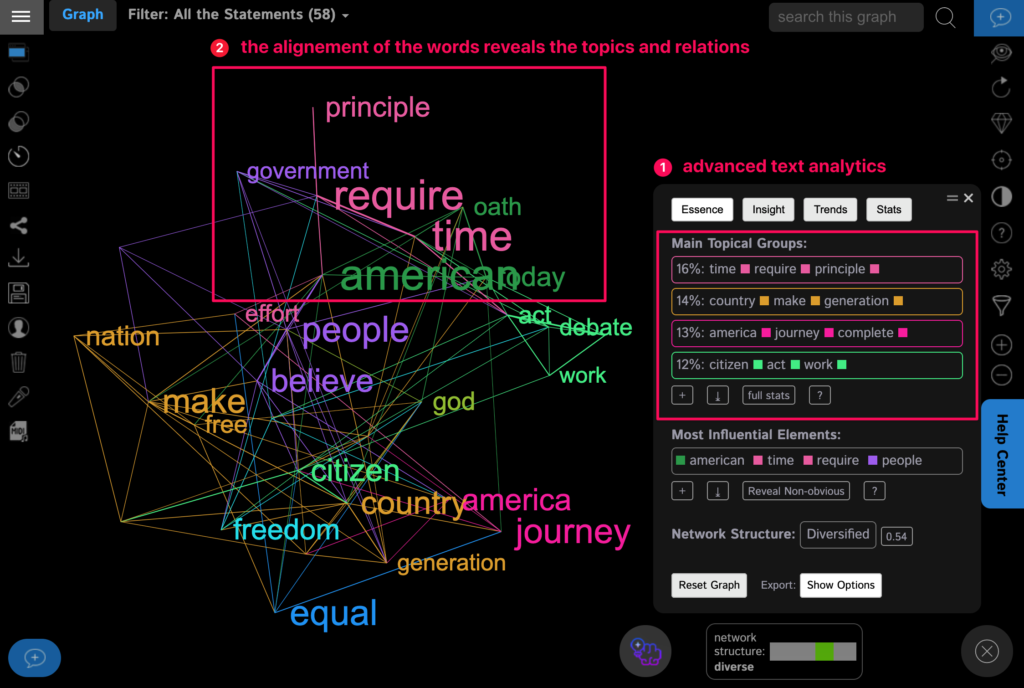
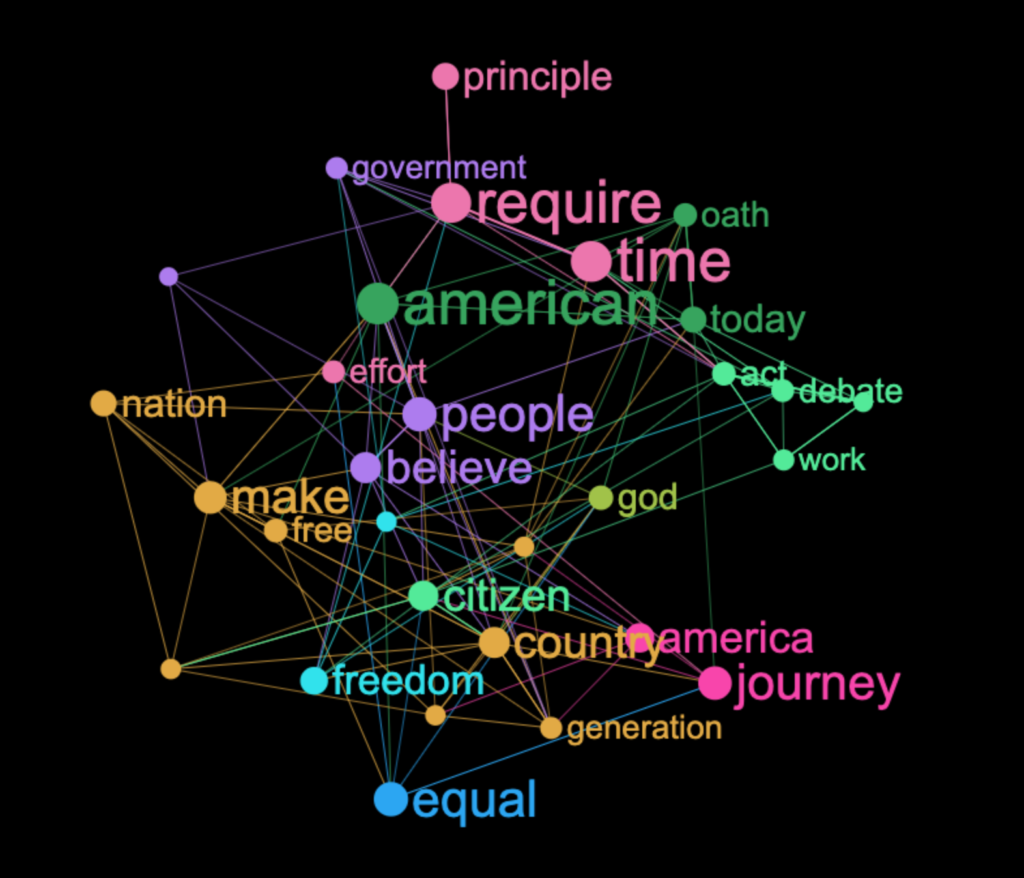
Take a look at this mind map of Obama’s 2013 address made using InfraNodus:
On this word cloud the closer the words are to each other, the more related they are in the context of the text. If the words have the same color, they belong to the same cluster, meaning that they tend to occur next to each other in this text. (We explain the science in the next section of this article below)
Based on this approach, we can quickly see that Obama is talking about “time requires” a lot, as well as “make people believe”, “America journey complete” and “create equal man”. “American” is the most influential term in the middle of the graph, connecting all the topics together. We understand that he’s talking about the demands of the time, the journey that America has to make, equal opportunities, and belief.
If we were to put this same text into a popular word cloud generator, TagCrowd, we’ll see something like that:
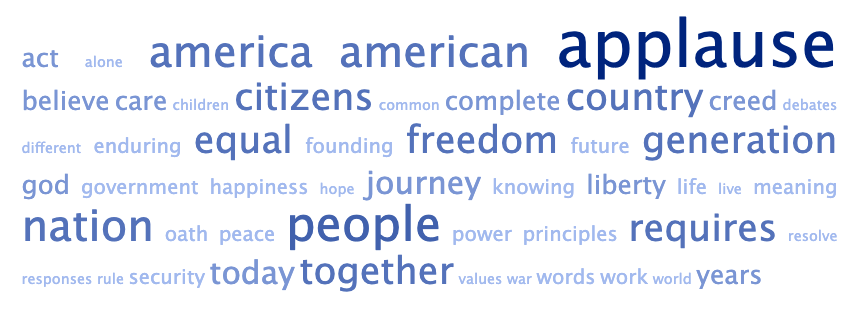
As you can see, this visualization lacks context. We cannot remove the word “applause” and even if we did, we just see general terms like “people” or “freedom” or “American”, which we can see in any presidential address. What matters is the context and the traditional word cloud tools just cannot analyze that.
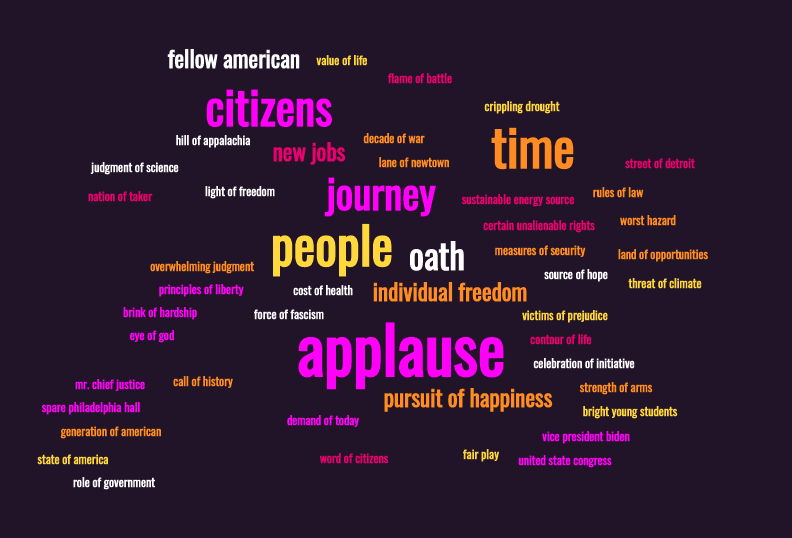
Even if we look at a more advanced MonkeyLearn word cloud generator, which uses machine learning under the hood, we will see that the results we obtain still lack the contextual information, even if they can show the most frequently occurring phrases within the text:
Alternatively, a word cloud made using InfraNodus generator also offers a set of powerful analytical tools and insights that can be used to understand the underlying text better and to tell a more effective story about the content:
Moreover, in InfraNodus it is possible to select a few words and delete them from the graph to see what’s hiding behind them, so you can use the word cloud iteratively, gradually uncovering layers of hidden information contained within.
As a result, unlike the traditional word cloud creator tools, network visualization can answer some important questions about the structure of the original text and its semantic network.
A word cloud based on text network analysis becomes a really useful analytical tool, taking the concept a step further. Below we will explain how this approach works.
How to Derive Conext from Word Clouds
By now, you might be curious: how does this work?
The idea is very simple, it is fully described in our peer-reviewed paper on text network analysis presented at The World Wide Web conference in 2019 titled “InfraNodus: Generating Insight using Text Network Analysis”.
Every word in a text is represented as a node, every co-occurrence is a connection between them. Based on this representation we build a network graph of the text, applying Force Atlas 2 layout to it. What this layout does is that it pushes apart the most connected nodes (hubs), while the less connected ones are getting clustered around the hubs.
As a result, you get a clear spatial representation where the proximity of the terms will reflect their semantic proximity in this particular context. In this way, it is much more precise than traditional word cloud generators, because it the way the words are positioned reflects their tendency to co-occur in the text.
We then use betweenness centrality ranking algorithm to range the nodes based on their global influence in the text and apply a community detection algorithm that will cluster the nodes further into groups of the same color if they have a tendency to co-occur together. This means that the bigger are the nodes, the more distinct topics they connect together.
The betweenness centrality measure is much more interesting than the measure of frequency, because we take into account the global connectivity of each word. Using this approach, we can answer the question: what are the words that are crucial to this discourse, that do not only often occur in this text, but that are positioned at the crossroads of meaning circulation, helping shape this particular narrative.
As a result, you see a neat graph, which can indicate the words that tend to co-occur more often together than others. On top of that, you can use the graph analytics tools to get the important structural insights about the discourse, the narrative, and every topic.
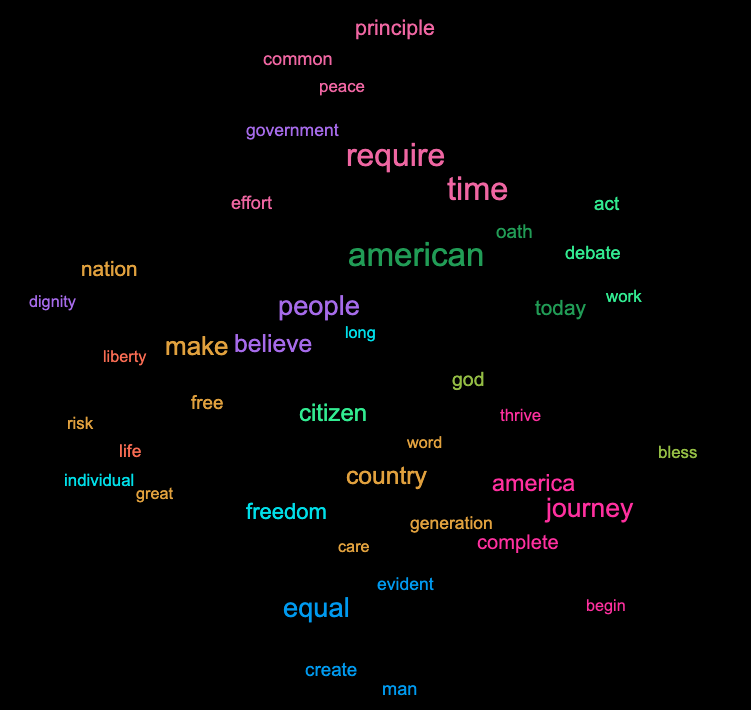
In the “word cloud” mode we simply remove the nodes and the edges, leaving the labels only, so that the result looks more like a traditional word cloud. You can, of course, turn these features on and off as you wish.
If you like this approach, we invite you to try generating a word cloud with your own data using our advanced network analysis and visualization tool InfraNodus.Com
