• Home
  • /
  • visualization
  • Textexture: The Non-Linear Reading Machine

    When we read a text, we normally follow it in quite a linear fashion: from left to right, from top to bottom. Even when we skim articles quickly online, the trajectory is still the same. However, this is not the most efficient method of reading: in the age of hypertext we tend to create our own narratives using the bits and pieces from different sources. This is an easy task with short Tweets or Facebook posts, but it becomes much more difficult when we’re dealing with newspaper articles, books, scientific papers. The amount of information we’re exposed to increases from day to day, so there’s a challenge of finding the new tools, which would enable us to deal with this overload.

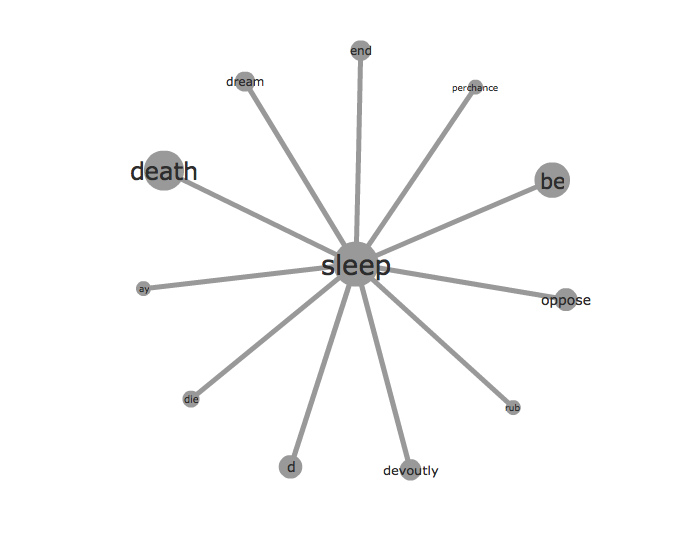
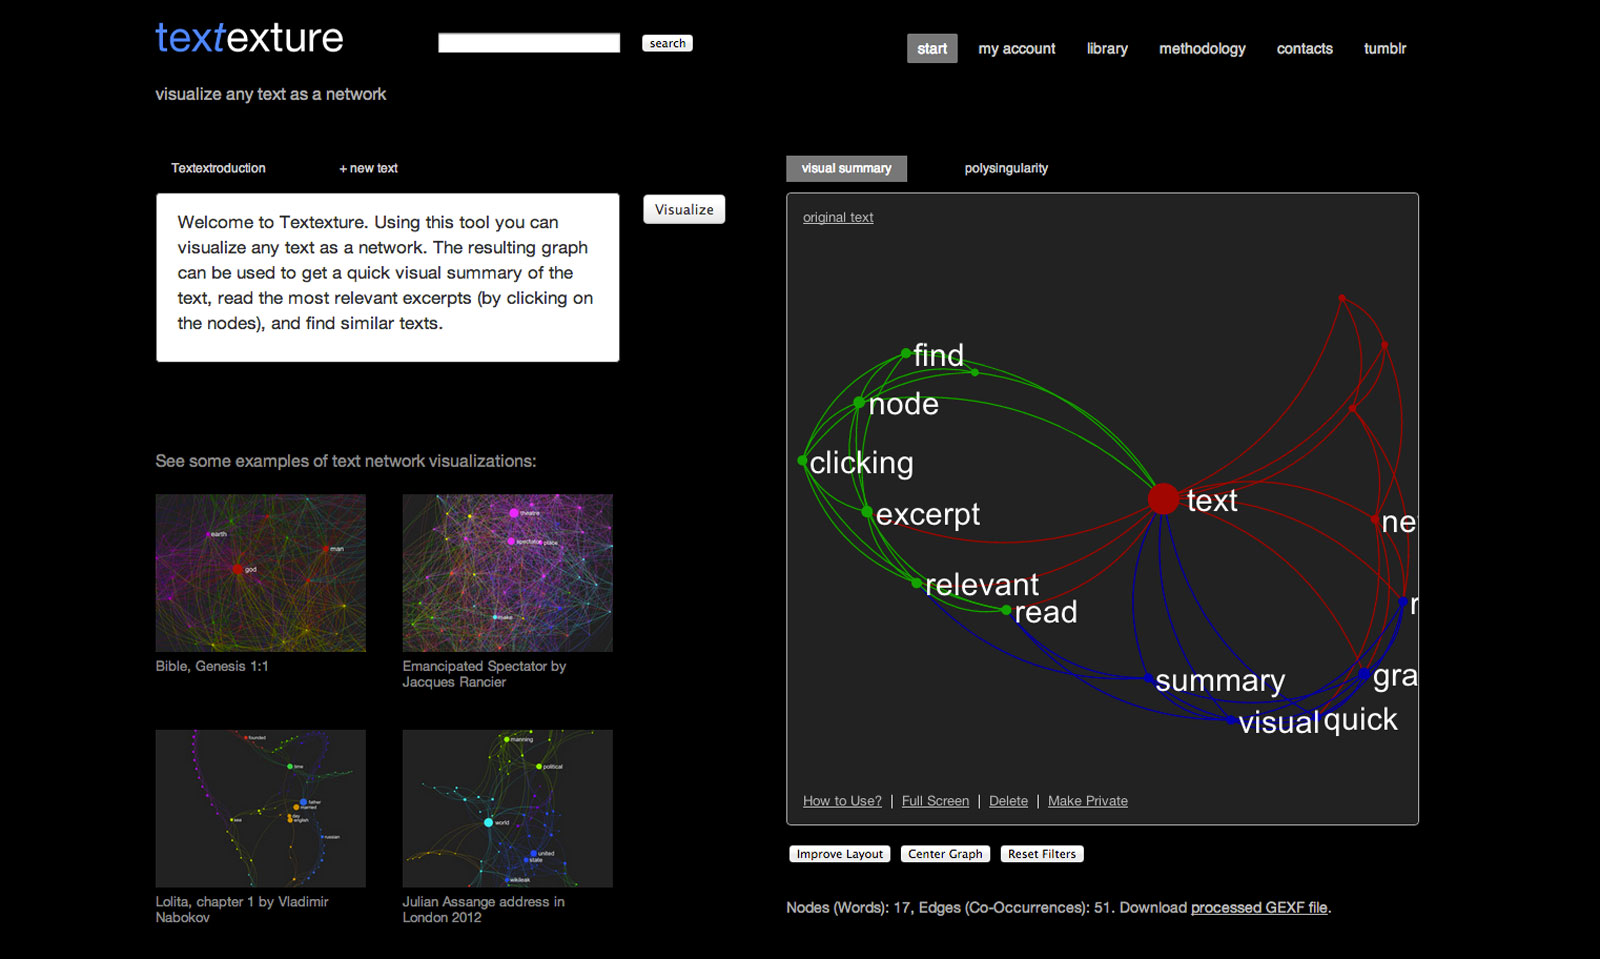
    As a response to this challenge we at Nodus Labs developed a new free online software tool Textexture.Com, which visualizes any text as a network and enables the user to use this interactive visualization to read through the text in a non-linear fashion. Using the network one can see the most relevant topics inside the text organized as distinctively colored clusters of nodes, their relationship to one another, and the most influential words inside the text, responsible for topic shifts. This way the user can navigate right into the topic of the text that is the most relevant to them and use the bigger (more influential) nodes to shift into another subject.

    Read More
  • Sigma.Js – The Amazing New Online Graph Visualization Tool

    Alexis Jacomy who made some of the best applications for web graph visualizations (SIGMa and GexfWalker among them) has come up with the new tool Sigma.Js, which is going to be huge and I’ll explain why.

    Read More
  • Types of Networks: Random, Small-World, Scale-Free

    Information Theory of Complex Networks: on evolution and architectural constraints paper by Sole and Valverde (2004) features a very interesting chart that shows how different types of networks relate to each other in terms of their randomness, heterogeneity, and modularity. We’ve tried playing around with these different structures using InfraNodus network visualization tool to see how different types of networks have different structural properties.

    Read More
  • The Dynamics of Facebook Protest

    This is a report on the experiment that Nodus Labs conducted on some of the more active Russian protest Facebook groups formed after the rigged Russian election in 2011. We made two network visualizations for three different protest groups over a period of one month in order to observe their dynamics. We found that the most influential members of these groups were not too politically engaged before the elections and were mainly journalists, students, event organizers, and media workers. We also found that the groups formed around ideological causes (such as “Putin must leave”) stagnated in their development in January 2012, while the groups formed around a call for active participatory actions (“Volunteers for the fair elections”) have grown in size and density considerably, building a very well connected and yet open network that was able to bring many new members together around their cause.

    Read More
  • Text Network Hamlet Reading

    We visualized Hamlet’s “to be or not to be” as a text network and then read it again using Alexis Jacomy’s GexfWalker. Whether it is a new reading of Shakespeare’s classic or a bunch of unrelated words is for you to decide, but at least it allows for polysingularity of text to be expressed more fully through following the word relations while staying loyal to the text’s original structure.

    Read More
  • Page 4 of 6
Try InfraNodus — Text Network Visualization Tool Learn More