Posted by Nodus Labs | May 28, 2012
Sigma.Js – The Amazing New Online Graph Visualization Tool
Alexis Jacomy who made some of the best applications for web graph visualizations (SIGMa and GexfWalker among them) has come up with the new tool Sigma.Js, which is going to be huge and I’ll explain why.
Sigma.Js is a an open-source free javascript library, which draws graphs using html5 canvas element. This has many advantages comparing to flash: from being able to use it on iOS devices (iPad/iPhone enabled version modified by Matthieu Jacomy is coming out in a few weeks) to better integration with the rest of your code (imagine the potential use of network interfaces for navigation).
It’s very simple to use Sigma.Js and Alexis put a lot of examples to get you started on his website. Even if you don’t have a clue about programming, it’s pretty straight-forward. Download sigma.js and the supplement libraries and upload them to the /js/ folder on your server (or wherever else you prefer to store your javascript libraries). Then create a sample html file, copy and paste one of Alexis’ examples (our favorite one is the Fish Eye zoom), as well as the source .gexf file (the actual encoded graph data). Load the page in your browser, see how it looks, and then tweak some parameters inside the code, such as the size of the nodes, the colors, etc.
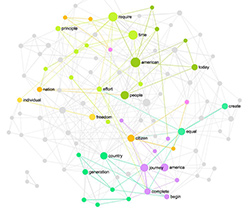
Here’s an example of using Sigma.Js to visualize Tumblr blog network. To zoom in / out use your mouse scroll / swipe trackpad. If you hover over a node, you’ll see all the other nodes in the network that it’s connected to. If you click on the node, you’ll open the Tumblr blog in a new window.
You can also see a very concrete example of how Sigma.Js can be used to create interactive network visualization with navigation elements in our new case study of Russian SMM community.

