
Posted by Nodus Labs | August 3, 2020
Visualize Connections between Your Notes with Roam Research and InfraNodus
Somebody once said that the best way to forget something is to take notes. While this may be an exaggeration, most note-taking tools are not very good at helping users do something meaningful with all the notes they’d taken. A range of the new note-taking apps coupled with InfraNodus text network analysis tool can help solve this problem.
Applications like Roam Research and Obsidian (based on Zettelkasten approach) have seen a lot of traction in the last months in the productivity app space. Their main advantage is the ability to make connections between different notes, so you can represent your knowledge as a network and think in terms of relations, not entities.
However, to make a link to another note, it is necessary to use [[wiki-links]], which is not easily readable and hard to do manually during the writing process especially if you are researching a new topic and do not yet know which ideas deserve a separate page:

Imagine, if you could automatically detect the most important and relevant concepts in your notes, so that you know what they’re about and how they are related. The new Markdown Import app in InfraNodus will solve this problem for you.
Using this feature you can import your Roam Research and Obsidian notes (or any notes that use markdown language and [[wiki-links]] — e.g. Zettelkasten’s The Archive or Foam). You can then visualize the main topics and their relations in every single note, so you can detect the structural gaps (where the new ideas are hiding) and discover the insights within each document using advanced network science tools via an easy-to-use interface:

The [[wiki-links]] connections between the pages and blocks will also be present in the graph and you can zoom out to only see those connections or zoom in to see the main topics that tend to emerge in your notes and the relations between them.
InfraNodus offers a much more granular analysis of your data, because it takes the words and concepts you use into account when building the graph. It also applies graph community detection algorithms and other network analysis tools to give you more insights about your text. Just compare this with the original Roam Research graph visualization and you’ll see that there’s a very big difference:

In this case study we will demonstrate how you can use this new feature of InfraNodus to visualize your Roam Research notes and to derive new ideas from them. You can also use any other note-taking tools: Obsidian — which is very similar to Roam Research, — the open-source and free Foam, DevonThink or Zettelkasten .txt or markdown files. InfraNodus can also be used to analyze Evernote notes with a dedicated Evernote import app.
Step 1: Analyzing a Roam Research Page
The first impulse is, of course, to feed all the notes that you’ve made into the software so it can magically generate the insight for you. However, we would advise against this approach.
We assume that every note that you made is meaningful in its own right, so just like it makes sense to eat a delicious dinner for a longer period of time it also makes sense to take time with every note and first analyze the relations that emerge from that particular note and only then see how they all connect together.
For instance, let’s use the public note on gamification by Rob Haisfield: https://roamresearch.com/#/app/Rob-Haisfield-Thinking-in-Public/page/XtzimCS2z
A note in Roam Research may look quite saturated with data because of the abundance of cross references, making it not so easy to read:
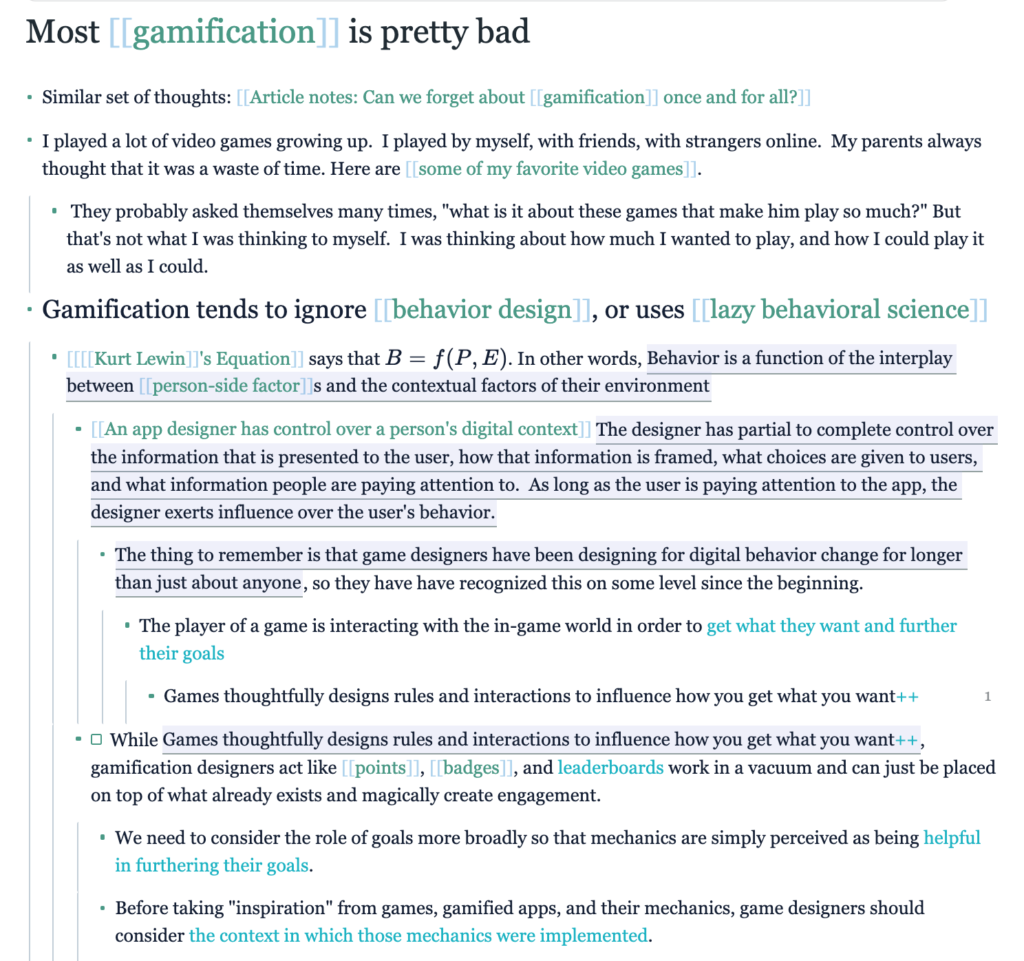
Imagine we want to come back to this note to remember what it’s about or to learn about it without having any background knowledge. It would be pretty difficult to do so using the bullet points above. However, if we import it into InfraNodus using the step-by-step Roam Research import guide, we will have a clear visual representation of the main concepts inside the page and the relations between them, which will be organized by InfraNodus into topical clusters:
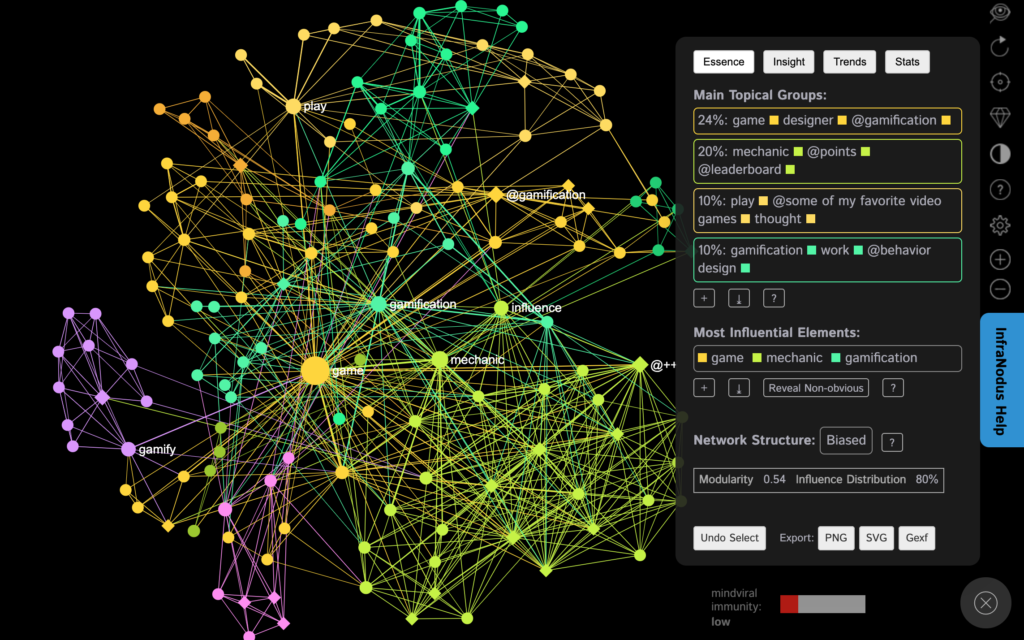
Just from looking at this page (click the direct link above to open the interactive graph) you will see that the main topics are:
24%: game / designer / [[gamification]]
20%: mechanic // [[points]] / [[leaderboard]]
10%: play / game / thought
10%: gamification / work / [[behavior design]]
* Note, that by default InfraNodus converts the [[wiki-links]] into @mentions, so that they are more visible in the graph (you can modify this behavior if you wish in the Settings).
This quick overview gives us a clear idea that Rob is talking about the game designers and the various gamification strategies used (leaderboards and points being the most important ones), he also talks about his personal experience (the 3rd topic) and how games can affect behavior (the 4th topic).
If we click on any of the concepts that we find interesting (e.g. gamification, work, behavioral design), we can quickly get to the block of the note where he’s talking about these concepts:

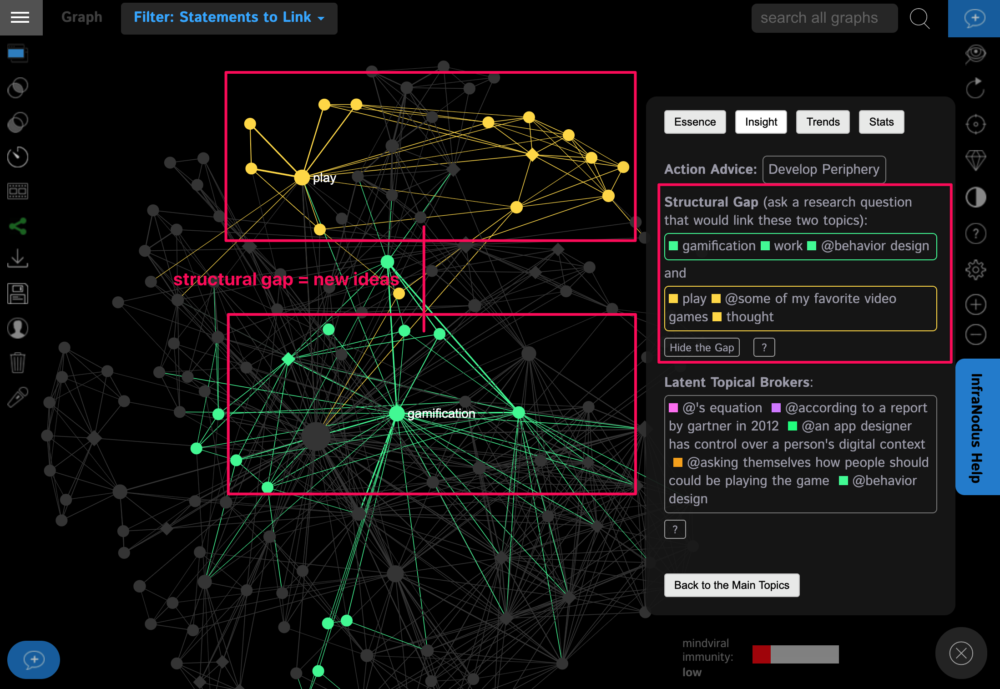
Now that we have a good overview of what the notes are about we can also use InfraNodus’ Insight feature to discover the structural gap in the discourse and identify a new and potentially interesting idea that could propose a new connection between the main topics inside this note:

In this case InfraNodus proposes us a connection between the topic of gamification • work • behavior design and the accounts of the personal experience of the author playing the games. How did the games he played in his youth affected him? Where does this inspiration with behavior design through the games come from?
2. Analyzing Several Notes at Once
Now that we have a good idea about a single note we can add more notes into our analysis and see how they all connect.
There are two ways to add more files: they can be imported as the separate graphs or into the same graph (for now, one by one). The first approach is more suitable if you have longer notes and want to analyze each note separately. The second approach suits best if you want to get a general overview of your knowledge database.
Note that all the [[wiki-link]] references inside those notes will be recorded as @mentions by default showing you also which links tend to appear in the same context (this behavior can be changed in settings and in the import app). So the resulting graph that you build will consist not only of the words used but also the links between the different pages (this feature is still in development).
Once we add a few notes into the system (the exact workflow for that is shown in the tutorial) we can use the “see all graphs” function in the menu to see all of them simultaneously as a graph:
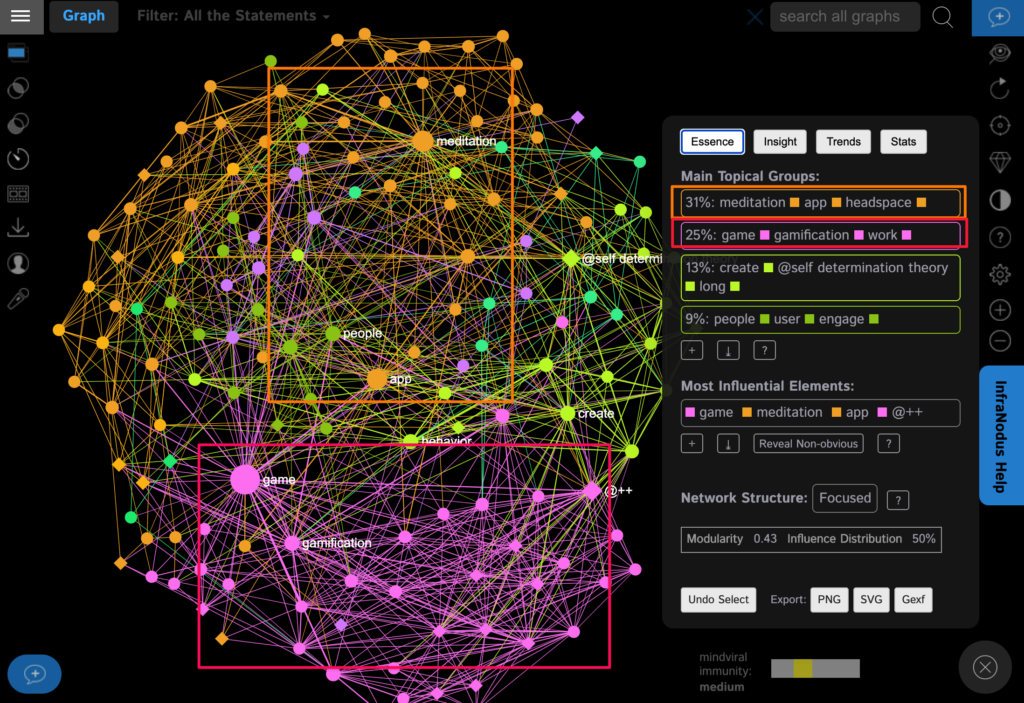
We can also use the filter function and only see the connections between the different [[wiki-pages]] that are present within our documents:

This sort of visualization helps us gain both a general overview of our ideas, find the structural gaps in order to generate new insights, as well as understand the links between all our different notes and blocks.
Feel free to try it out using InfraNodus.Com and send us a question if you need help or have feedback and feature suggestions!
