keyword graph

  • Home
  • /
  • keyword graph
  • Find the Gap between the Demand and Supply

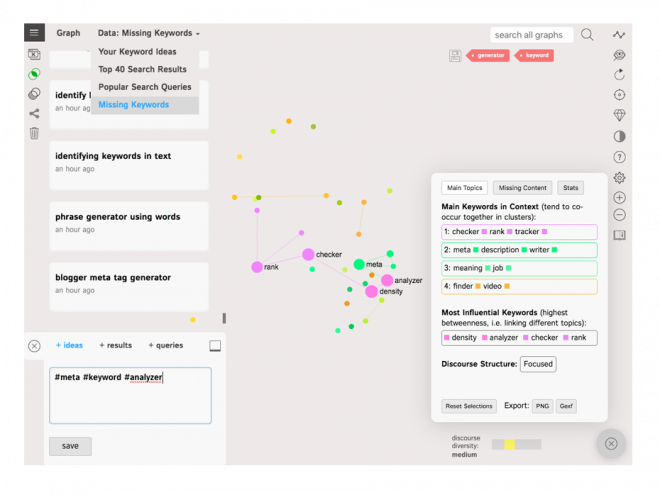
    The most powerful feature of Keyword Graph is the ability to find the gap between the demand and supply. It creates a substraction of two graphs: the graph of the search queries used in conjunction with the one you added and the Google search results for that query. The result is the graph that contains the terms that people search for but cannot find. Not only that, but it also shows you these terms in context: so you can identify which groups of keywords to use to identify the right target niche for your market. Try Keyword Graph Now

    Read More
  • Visualize the Most Influential Keywords and Topics

    Keyword Graph can visualize the most influential keywords and topics, so you can learn what people are searching for. Just enter a search query and it will create two graphs: A graph of Google’s top search result for your query, showing you the main terms and are present in the search results and how they are related, so you can quickly learn the context (the supply) A graph of the search queries that people tend to use with your original one, so you better understand what people are looking for (the demand) These two graphs will give you a very […]

    Read More
  • Keyword Graph for SEO

    Keyword Graph from InfraNodus is a powerful SEO visualization tool that can reveal patterns in search intent and search results. You can use these insights to build topical authority in your field and to understand what people search for but don’t yet find. Learn more about it below or try it out on InfraNodus Try Keyword SEO Graph Now

    Read More
Try InfraNodus — Text Network Visualization Tool Learn More