
Posted by Nodus Labs | July 23, 2019
Network Analysis of HotJar Customer Feedback
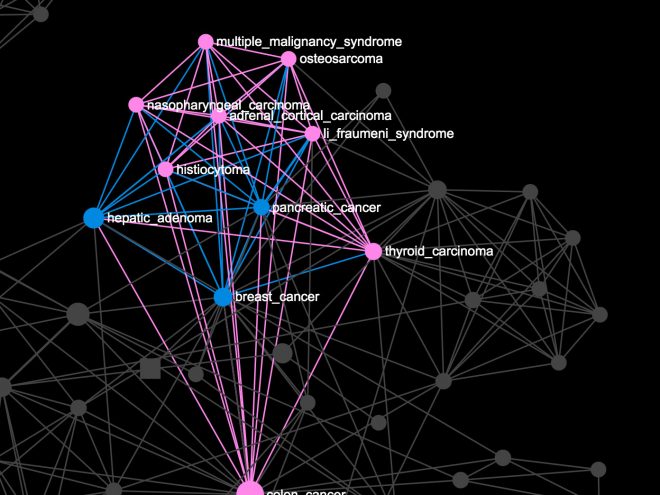
How to build brand association maps using customer feedback and visualize the main topics as well as the connections between them.
How to build brand association maps using customer feedback and visualize the main topics as well as the connections between them.
How to create or import a gexf graph file and to then share it with others as a URL or an iFrame embed.
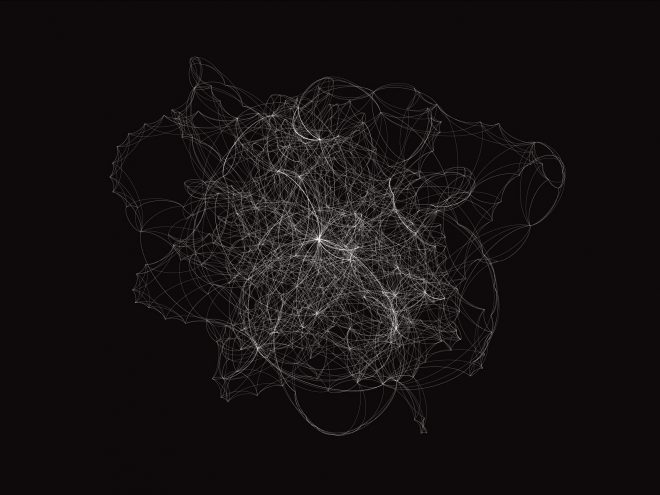
The origin of the word “text” is from the Latin “texere”, “to weave”. When we write text, we are weaving together the different threads of meaning to produce a coherent whole. Network analysis allows us to see patterns in this totality, to see both the whole woven garment and the (meaning) threads within.
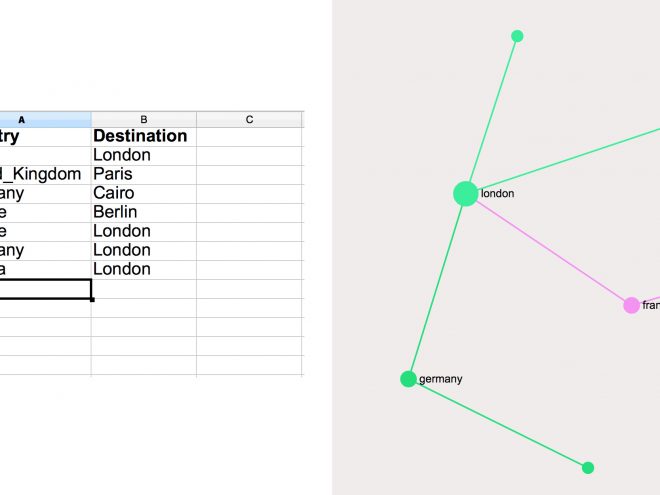
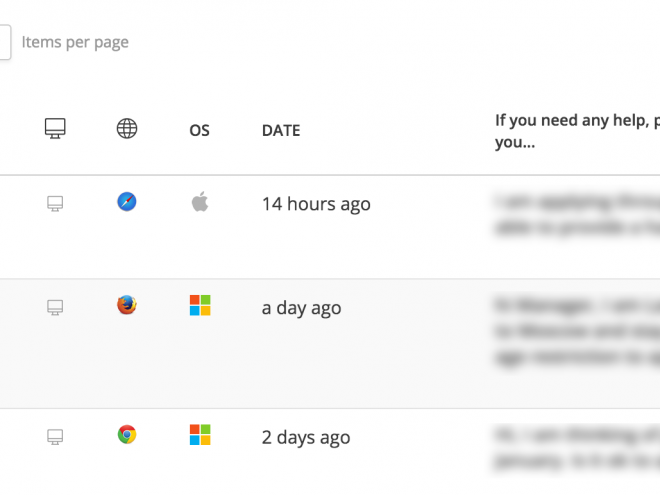
Surveys usually come in CSV / Excel formats and network visualization techniques can be very helpful to make more sense of the data. In this short tutorial we will demonstrate how network analysis and visualization can be used to discover crucial relationships in the survey data.
A detailed account of our presentation and workshop at CCC 35C3 hacker conference where we proposed a new kind of software for the body based on the patterns of movement and physical interaction — and its implications for the development of AI.
