
Posted by Nodus Labs | November 5, 2012
Textexture: The Non-Linear Reading Machine
When we read a text, we normally follow it in quite a linear fashion: from left to right, from top to bottom. Even when we skim articles quickly online, the trajectory is still the same. However, this is not the most efficient method of reading: in the age of hypertext we tend to create our own narratives using the bits and pieces from different sources. This is an easy task with short Tweets or Facebook posts, but it becomes much more difficult when we’re dealing with newspaper articles, books, scientific papers. The amount of information we’re exposed to increases from day to day, so there’s a challenge of finding the new tools, which would enable us to deal with this overload.
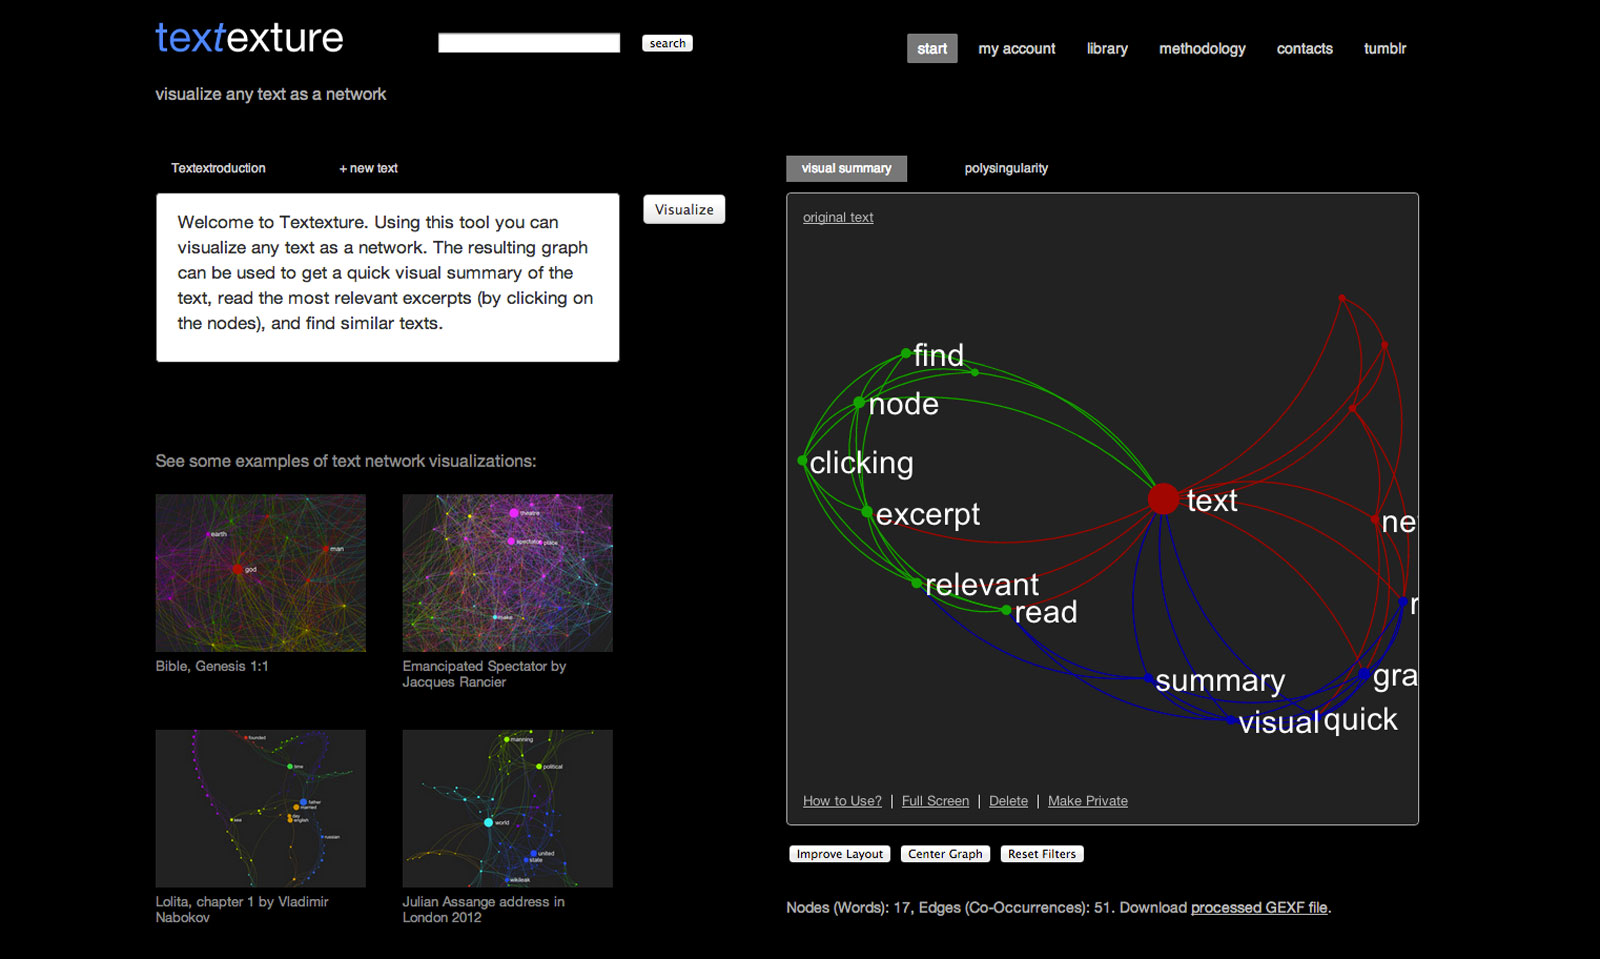
As a response to this challenge we at Nodus Labs developed a new free online software tool Textexture.Com, which visualizes any text as a network and enables the user to use this interactive visualization to read through the text in a non-linear fashion. Using the network one can see the most relevant topics inside the text organized as distinctively colored clusters of nodes, their relationship to one another, and the most influential words inside the text, responsible for topic shifts. This way the user can navigate right into the topic of the text that is the most relevant to them and use the bigger (more influential) nodes to shift into another subject.
Project: Textexture.Com
Objective: Provide an easy-to-use online tool for text network visualization, fast non-linear reading, and comparative analysis of textual data.
Additional Info: Created by Nodus Labs, using the open-source free Gephi software and Sigma.Js toolkit.
The methodology behind Textexture is quite simple. First, a submitted text is scanned to remove all the most frequently used “stopwords”, such as “are”, “is”, “the”, “a”, etc. The second scan removes any extra characters and turns every word into its morpheme (e.g. “took” becomes “take”, “plates” becomes “plate”). The resulting sequence is then scanned so that every word is encoded as a node and their co-occurrence is encoded as the connection between them. The nodes are not only linked if they are next to each other in the text. The paragraph and sentence structures are taken into account, as well as the Landscape reading model, according to which our memory creates a landscape of concepts that are more likely to be activated during the reading process.
The resulting node-edge structure is encoded into a graph format and is processed by Gephi server-side Java toolkit, which calculates the basic metrics and applies community detection algorithms for the graph. The size of the nodes is then ranged according to their betweenness centrality (a measure of how often a node appears on the shortest path between any two randomly chosen nodes in the network), thus emphasizing the words, which often appear at the junctions of meaning. This is different from highlighting the most frequently used words as most programs do, because the words with the highest betweenness centrality are not necessarily often used within a text. They are rather the keywords that are often used to switch from one context to another within the text. Obviously, if a text has only a few contexts there will be a higher correlation between these two measures. The nodes are then colored according to the community they belong to. The nodes are considered to belong to the same community if they are more densely connected together than with the rest of the network. Modularity iterative algorithm embedded in Gephi does the job of finding these communities.
As the final step, the graph is visualized using Sigma.Js library by Alexis Jacomy, which also applies Force Atlas layout, which pushes the nodes that belong to the same community together and pushes those communities apart in order to provide a more visually readable image of the graph.

The resulting graph image of the text can be used to get a quick visual representation of the main topics and influential keywords inside a text. According to studies in cognitive science, such visual maps can aid text comprehension tremendously. As the next step, the users can also click on the nodes within the graph. Then the parts of the text which have the term selected will be shown on the left-hand side. Like this the users can quickly skim through the text selecting the parts that are most relevant to their interests. The organization of network interface where the more prominent topics and keywords are visually emphasized allows this non-linear reading to occur in the way, which is still related to the original narrative. This is the difference from the tag clouds: the terms are organized according to how they are related to one another and the local structures within the text are made visible too. Tag clouds simply show the most frequently mentioned words ranging them in alphabetical order.
Our future plans are to make Textexture available through an API and to develop task-specific software based on it, such as the news reader, Facebook profile comparison tool, augmented search engine, etc. If you’re interested in collaborating, please, do contact us!
Below is the above text represented through Textexture. By the way, as you can see, all the graphs can be made publicly available and embedded on any website with just a copy and paste code.
