
Posted by Nodus Labs | February 17, 2012
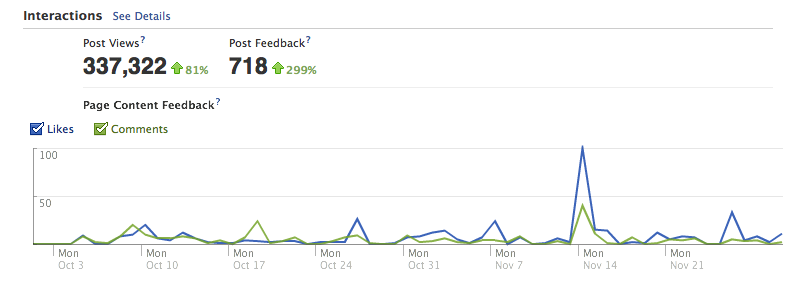
Figure 8: The number of interactions and viral reach during October-November 2011
Try InfraNodus Text Network Visualization Tool developed by Nodus Labs. You can use it to make sense of disjointed bits and pieces of information, get visual summaries for text documents, and generate insight for your research process: www.infranodus.com
