Case Studies

  • Home
  • /
  • Case Studies
  • Coronavirus SARS-CoV-2 Genome Sequences as a Network Graph

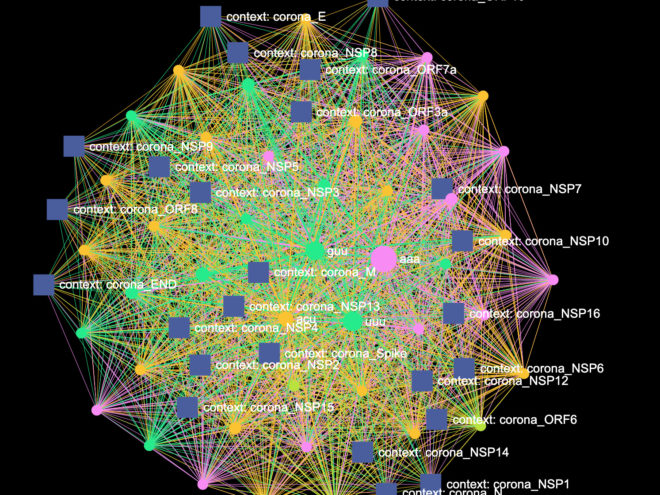
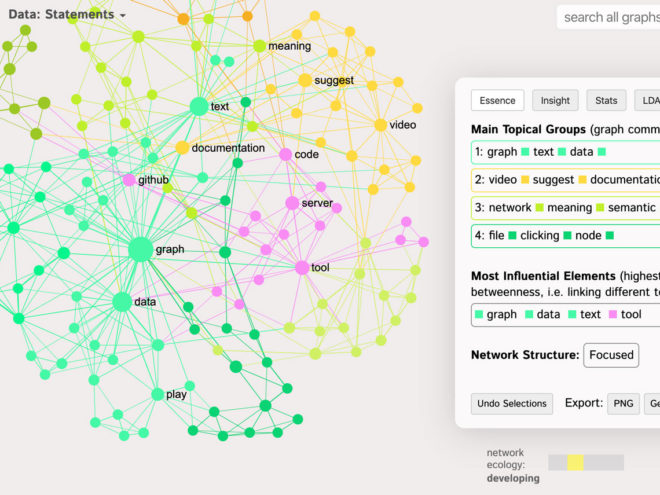
    Teams of researchers around the world are racing to understand the Coronavirus genome and to decode its functions. We used InfraNodus text network analysis and visualization tool to represent the RNA sequence of Coronavirus as a network graph.

    Read More
  • Sentiment Analysis using Text Networks

    How to improve sentiment analysis using text network visualization that helps you see not only the most prominent topics but also the correlations between the responses of customers. Using the example of online surveys and Twitter data.

    Read More
  • Network Graph as a Musical Instrument

    Music can be visualized as a graph. While there are many ways to do that, one of the possibilities is to represent the notes (and octaves) as the nodes and their co-occurrences as the connections between them. This representation allows us to reveal patterns in our composition and to use the powerful graph theory algorithms to uncover interesting insights about the structure of the music we’re playing.

    Read More
  • SEO Keyword Generation using Network Visualization Tool

    Identify the keywords that will help you integrate into a discourse and find your niche within.

    Read More
  • Generate a Word Cloud with a Context

    Word clouds are used to generate visual summaries of text, however, they have one major deficiency: they completely lose track of the context. As a result, there is a risk of getting false meaningless results and making the wrong assumptions about the underlying data. Text network analysis and visualization  can solve this problem.

    Read More
  • Page 6 of 17
Try InfraNodus — Text Network Visualization Tool Learn More